
Americans have been migrating to the south and west for the last several years, particularly from states in the Northeast. That trend held true in 2019, according to a study by United Van Lines. Using data from moves conducted by the company in the 48 contiguous states, plus a survey of customers, the company compiled a list of the states people moved to and from the most. Here’s what they found in their analysis of states people are leaving.
California joins the top 10 states people are leaving
For the first time in the study’s 43-year history, California joined the top 10 states that people are leaving. According to the survey, nearly 40 percent of those leaving California cited a new job/company transfer as their reason for moving.
In fact, the survey revealed that, across all regions, a major driver of migration is a career change. Approximately one out every two people who moved with the company in 2019 moved for a new job or company transfer.
Methodology
Only states with more than 250 moves total were counted, which left Vermont out of the final tally. The company conducted just 214 total moves in and out of Vermont.
Also, several states saw nearly the same number of residents moving inbound as outbound. Oklahoma and Maine are considered “balanced states,” with an almost equal 50/50 split among movers coming and going. Hawaii and Alaska were not included in the data collection.
Here are the 23 states people left the most in 2019:
23. Missouri
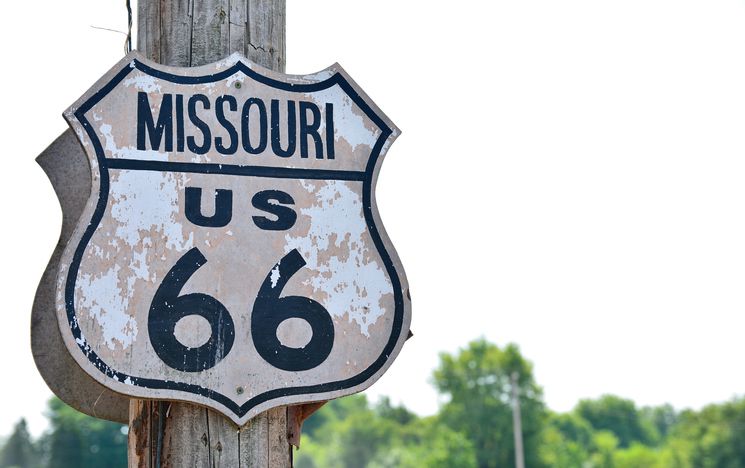
Image: StockPhotoAstur / iStock
Total moves: 3,398
In: 48.9%
Out: 51.1%
22. Pennsylvania

Image: Feverpitched / iStock
Total moves: 5,223
In: 48.8%
Out: 51.2%
21. Utah

Image: krblokhin / iStock
Total moves: 1,662
In: 48.6%
Out: 51.4%
20. Maryland
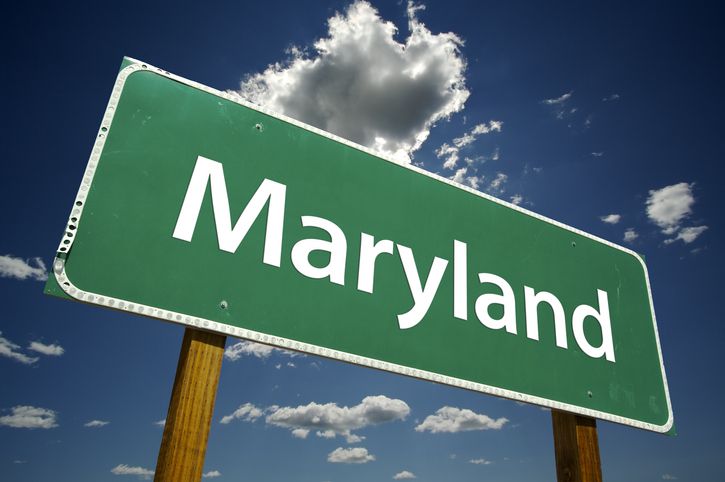
Image: Feverpitched / iStock
Total moves: 3,286
In: 48.4%
Out: 51.6%
19. Minnesota

Image: Ingo Dörenberg / iStock
Total moves: 2,697
In: 48.1%
Out: 51.9%
18. Mississippi
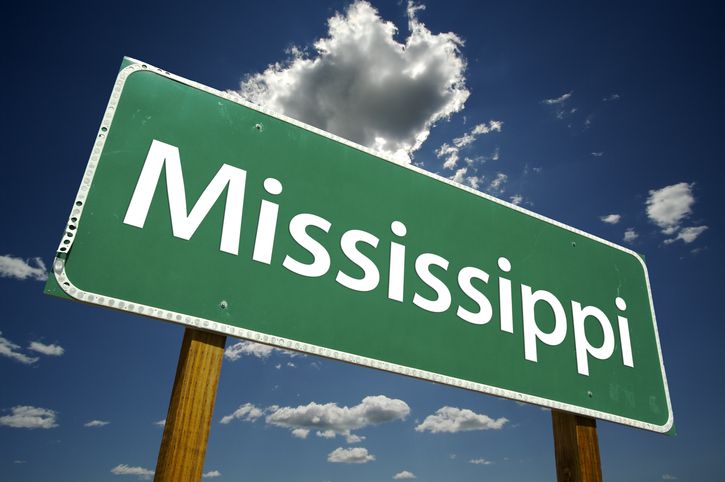
Image: Feverpitched / iStock
Total moves: 1,075
In: 48.0%
Out: 52.0%
17. Indiana
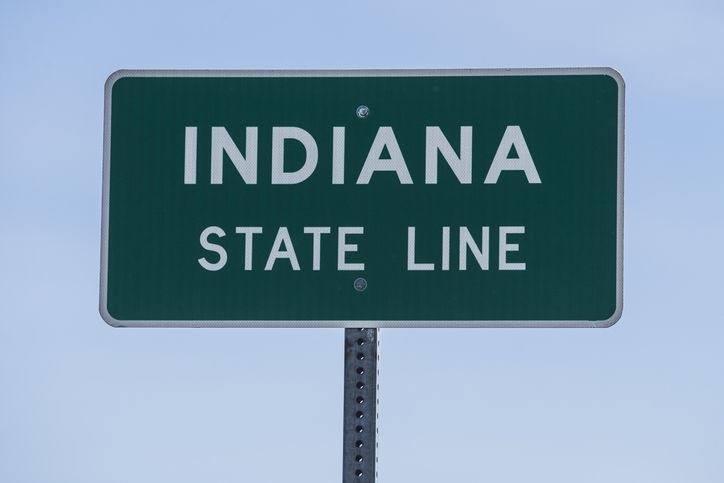
Image: fotoguy22 / iStock
Total moves: 2,384
In: 47.9%
Out: 52.1%
16. Kentucky
Image: gguy44 / iStock
Total moves: 2,107
In: 47.6%
Out: 52.4%
15. Wisconsin

Image: gguy44 / iStock
Total moves: 2,625
In: 47.4%
Out: 52.6%
14. Virginia

Image: Feverpitched / iStock
Total moves: 8,506
In: 47.1%
Out: 52.9%
13. Montana

Image: raksyBH / iStock
Total moves: 1,094
In: 46.1%
Out: 53.9%
12. Louisiana
Image: Cheri Alguire / iStock
Total moves: 2,012
In: 45.3%
Out: 54.7%
11. Massachusetts
Image: Feverpitched / iStock
Total moves: 3,875
In: 45.2%
Out: 54.8%
10. Iowa

Image: Rex_Wholster / iStock
Total moves: 1,213
In: 45.0%
Out: 55.0%
9. North Dakota

Image: Rex_Wholster / iStock
Total moves: 440
In: 44.8%
Out: 55.2%
8. Michigan

Image: ehrlif / iStock
Total moves: 3,764
In: 43.1%
Out: 56.9%
7. California

Image: greta6 / iStock
Total moves: 19,476
In: 43.1%
Out: 56.9%
6. Ohio
Image: gguy44 / iStock
Total moves: 5,395
In: 42.2%
Out: 57.8%
5. Kansas

Image: Tiago_Fernandez / iStock
Total moves: 1,982
In: 41.5%
Out: 58.5%
4. Connecticut

Image: Feverpitched / iStock
Total moves: 1,971
In: 37.0%
Out: 63.0%
3. New York

Image: venemama / iStock.
Total moves: 6,778
In: 36.9%
Out: 63.1%
2. Illinois

Image: venemama / iStock.
Total moves: 6,729
In: 33.5%
Out: 66.5%
1. New Jersey

Image: gguy44 / iStock.
Total moves: 4,059
In: 31.5%
Out: 68.5%
Enjoy state roundups? Check out this list of America’s best & worst cities for single men.
This article was produced and syndicated by MediaFeed.org.
Main image: JanaShea / iStock.
AlertMe