
You’ll often hear the common rule of thumb that the price of a home shouldn’t exceed three times your annual income. This can help homebuyers avoid becoming house rich and cash poor.
However, following this rule isn’t as easy as it seems. Despite the national recession sparked by the global COVID-19 pandemic, pent-up buyer demand and a lack of affordable homes throughout much of the country has pushed home prices higher in recent months.
Although record-low mortgage rates may offset some of the price increases, many buyers will likely need to take out larger home loans. As home prices continue to rise, buyers with stagnant incomes may need to stretch their budgets to afford a mortgage.
To see where borrowers are stretching their dollars the most to buy homes, LendingTree used information from the 2019 Home Mortgage Disclosure Act’s dataset to analyze how much leverage buyers have in the nation’s 50 largest metro areas. “Leverage” refers to the ratio of how much money is borrowed compared to a person’s income. In other words, LendingTree’s study ranks the places where people are taking out the largest home loans relative to their incomes.
Image Credit: monkeybusinessimages / iStock.
Methodology

To determine the cities with the most leveraged homebuyer budgets, LendingTree looked at 2019 Home Mortgage Disclosure Act (HMDA) data for the nation’s 50 largest Core-Based Statistical Areas (CBSAs). HMDA is a federal law that requires most lenders to report their origination activity every year. From this HMDA data, which represents more than 5.3 million mortgage purchase loans, the median amount borrowed was divided by the median income for all purchases in the HMDA database for each city looked at in LendingTree’s study.
Here are the top 25 cities where homebuyers are being squeezed the most.
Image Credit: iStock/bernardbodo.
25. Tie: Tampa, Florida
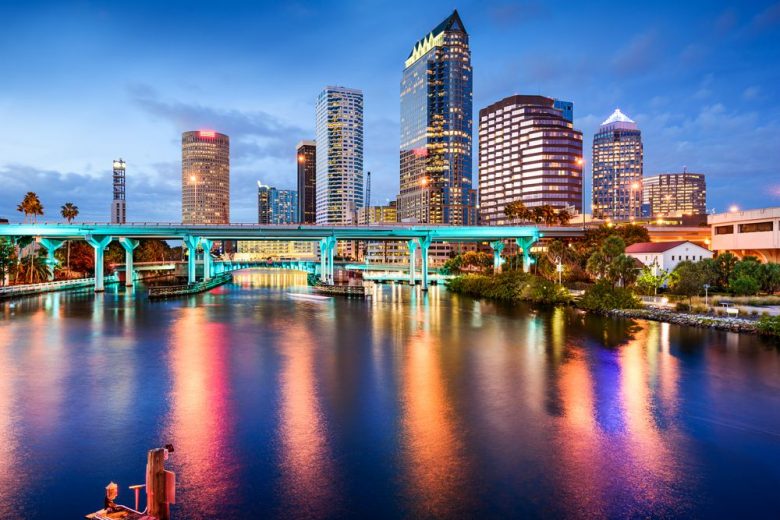
Median income: $77,000
Median loan amount: $215,000
Leverage ratio: 2.792
Image Credit: Deposit Photos.
25. Tie: Jacksonville, Florida
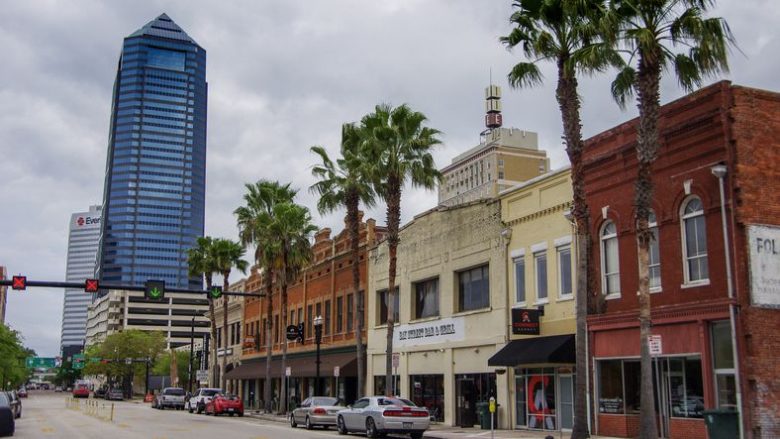
Median income: $77,000
Median loan amount: $215,000
Leverage ratio: 2.792
Image Credit: Philip Rozenski / iStock.
24. Atlanta
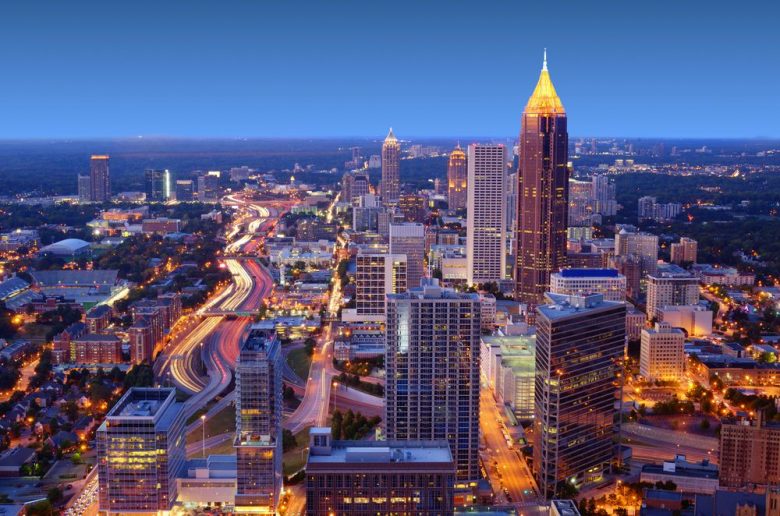
Median income: $79,000
Median loan amount: $225,000
Leverage ratio: 2.848
Image Credit: DepositPhotos.com.
23. Minneapolis
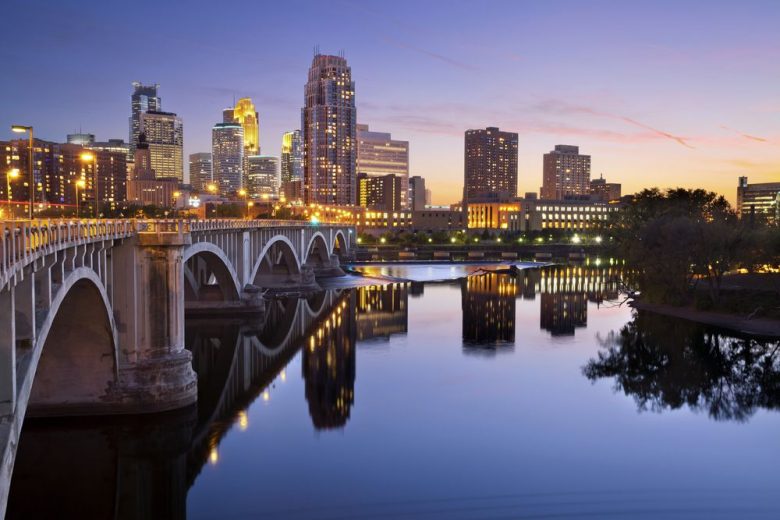
Median income: $85,000
Median loan amount: $245,000
Leverage ratio: 2.882
Image Credit: Deposit Photos.
22. Richmond, Virginia
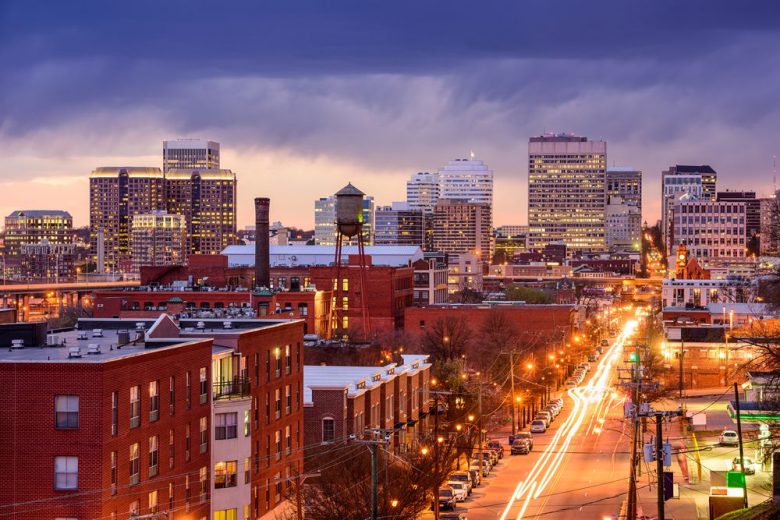
Median income: $80,000
Median loan amount: $235,000
Leverage ratio: 2.938
Image Credit: DepositPhotos.com.
21. Orlando, Florida

Median income: $79,000
Median loan amount: $235,000
Leverage ratio: 2.975
Image Credit: LUNAMARINA / iStock.
20. Baltimore

Median income: $92,000
Median loan amount: $275,000
Leverage ratio: 2.989
Image Credit: DepositPhotos.com.
19. Miami
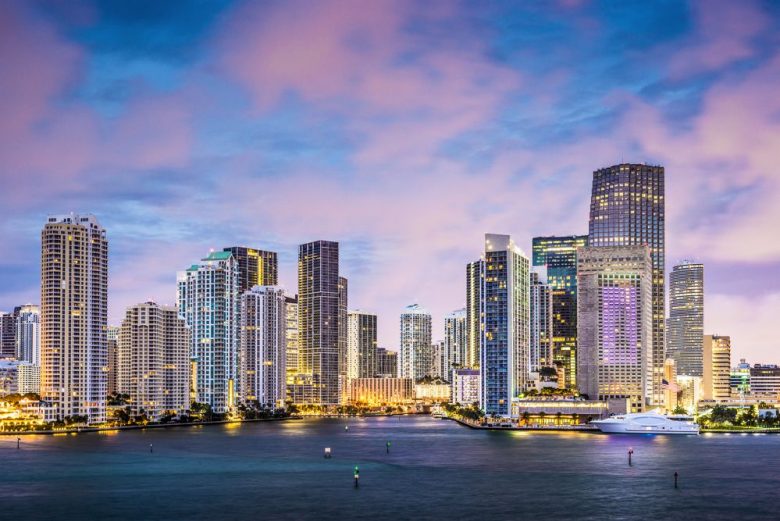
Median income: $88,000
Median loan amount: $265,000
Leverage ratio: 3.011
Image Credit: Deposit Photos.
18. Nashville
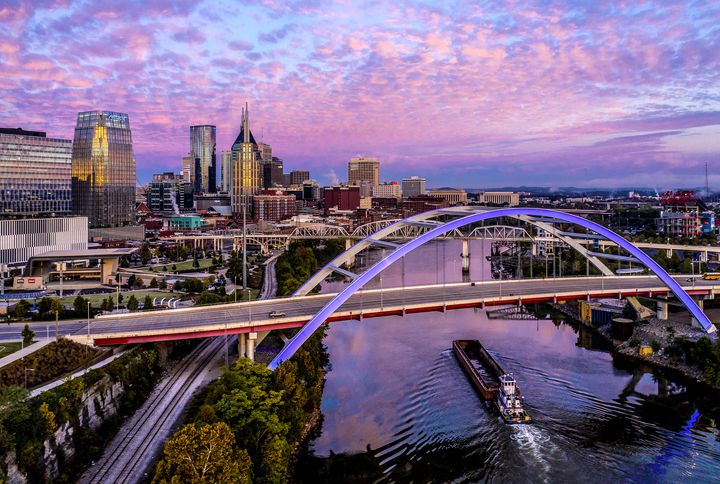
Median income: $84,000
Median loan amount: $255,000
Leverage ratio: 3.036
Image Credit: iStock.
17. Phoenix
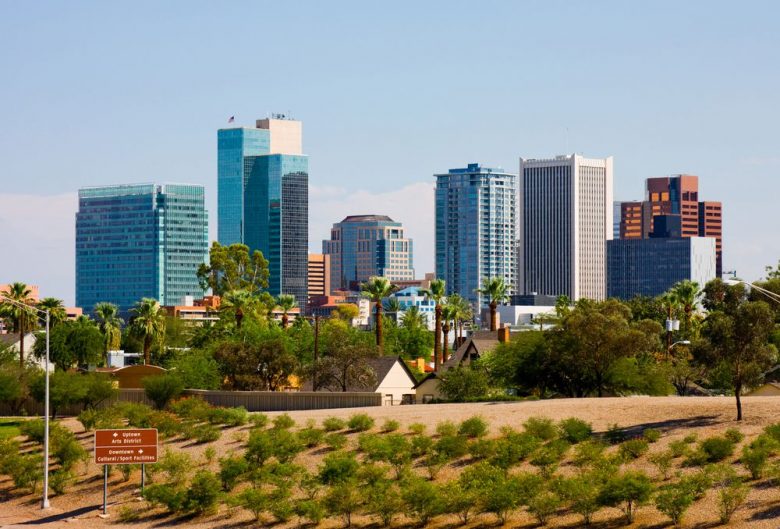
Median income: $80,000
Median loan amount: $245,000
Leverage ratio: 3.063
Image Credit: DepositPhotos.com.
16. Providence, Rhode Island

Median income: $83,000
Median loan amount: $255,000
Leverage ratio: 3.072
Image Credit: iStock.
15. Virginia Beach, Virginia
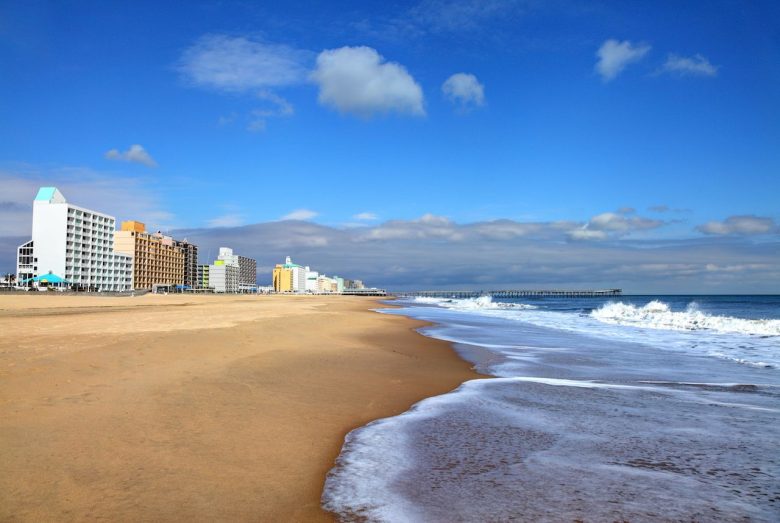
Median income: $76,000
Median loan amount: $235,000
Leverage ratio: 3.092
Image Credit: DenisTangneyJr.
14. Boston
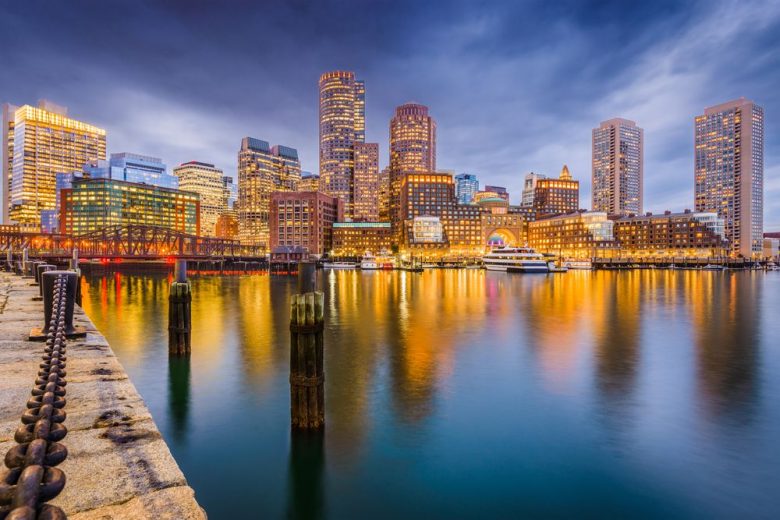
Median income: $120,000
Median loan amount: $375,000
Leverage ratio: 3.125
Image Credit: DepositPhotos.com.
13. New York
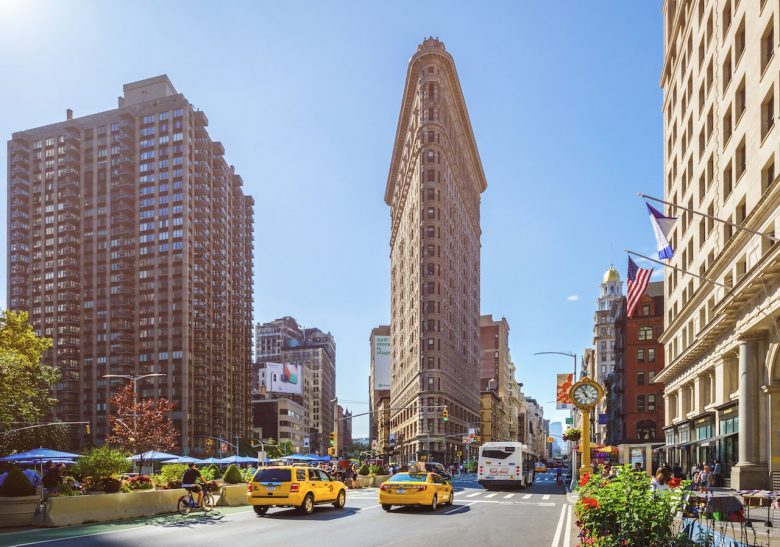
Median income: $122,000
Median loan amount: $385,000
Leverage ratio: 3.156
Image Credit: Eloi_Omella.
12. Sacramento, California

Median income: $103,000
Median loan amount: $335,000
Leverage ratio: 3.252
Image Credit: DepositPhotos.com.
11. Washington, D.C.

Median income: $114,000
Median loan amount: $375,000
Leverage ratio: 3.289
Image Credit: iStock/rarrarorro.
10. Portland, Oregon

Median income: $100,000
Median loan amount: $335,000
Leverage ratio: 3.35
Image Credit: iStock/Sean Pavone.
9. Las Vegas
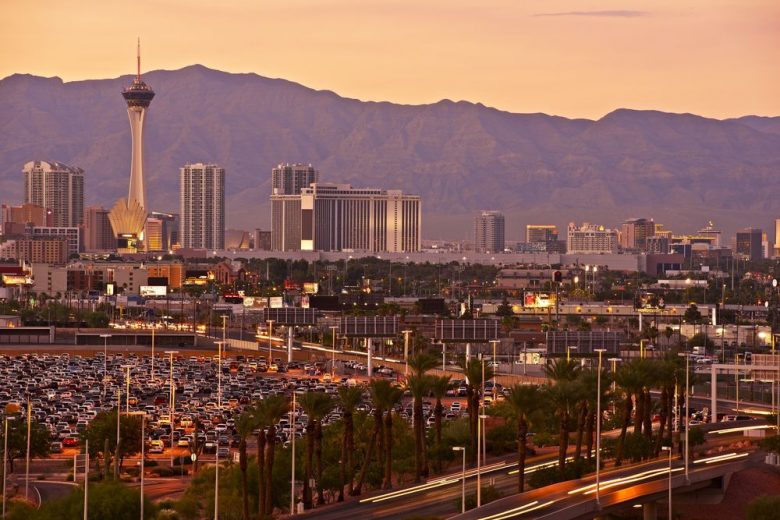
Median income: $79,000
Median loan amount: $265,000
Leverage ratio: 3.354
Image Credit: DepositPhotos.com.
8. Seattle
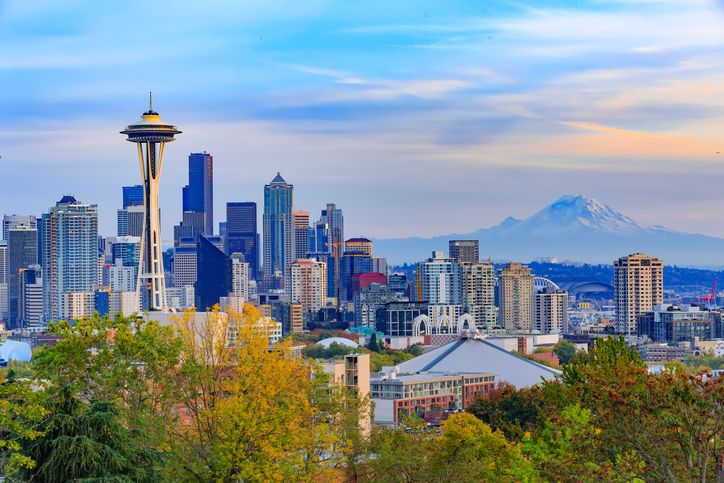
Median income: $119,000
Median loan amount: $405,000
Leverage ratio: 3.403
Image Credit: iStock/aiisha5.
7. San Francisco
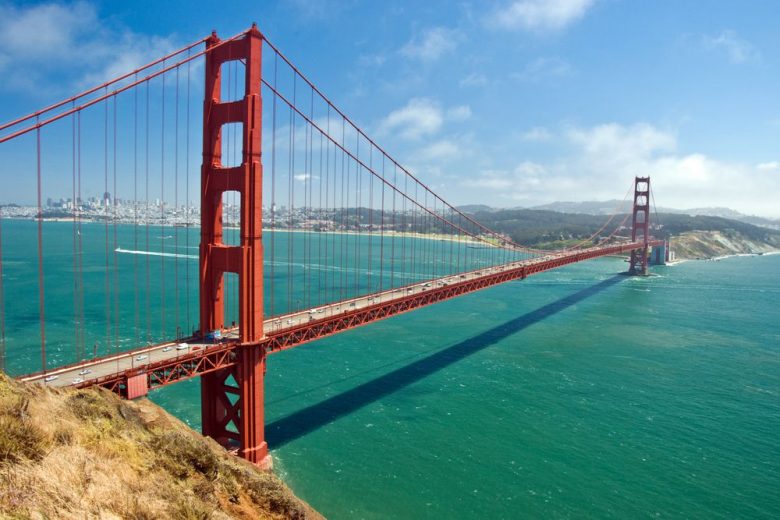
Median income: $189,000
Median loan amount: $645,000
Leverage ratio: 3.413
Image Credit: DepositPhotos.com.
6. Riverside, California

Median income: $92,000
Median loan amount: $315,000
Leverage ratio: 3.424
Image Credit: DepositPhotos.com.
5. San Jose, California
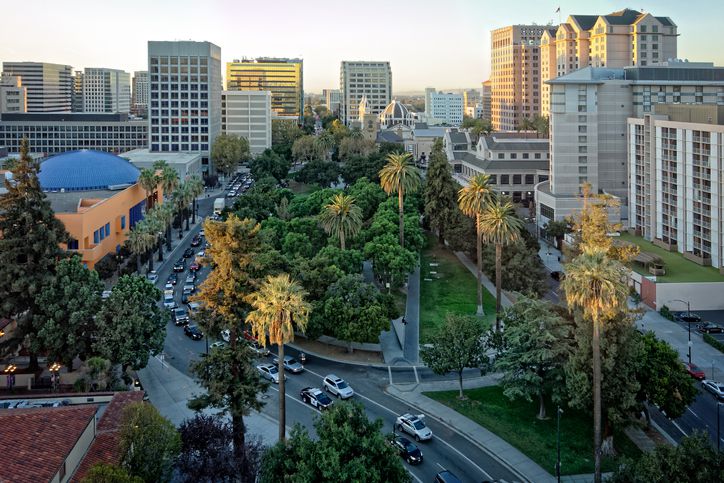
Median income: $210,000
Median loan amount: $725,000
Leverage ratio: 3.452
Image Credit: iStock/GerardoBrucker.
4. Denver
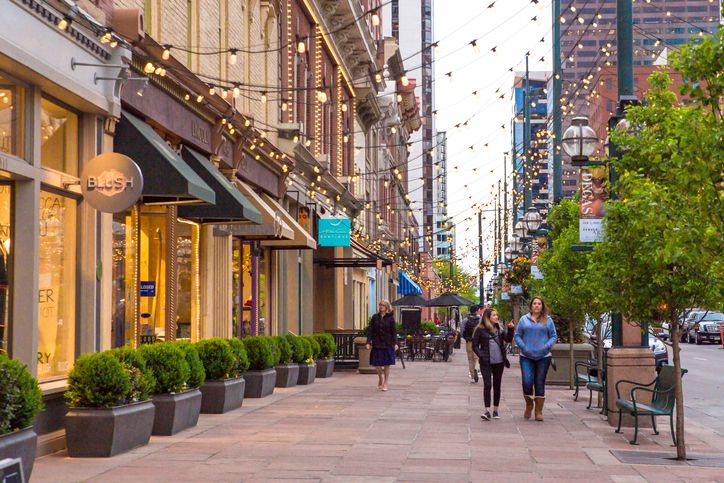
Median income: $101,000
Median loan amount: $355,000
Leverage ratio: 3.515
Image Credit: iStock.
3. Salt Lake City
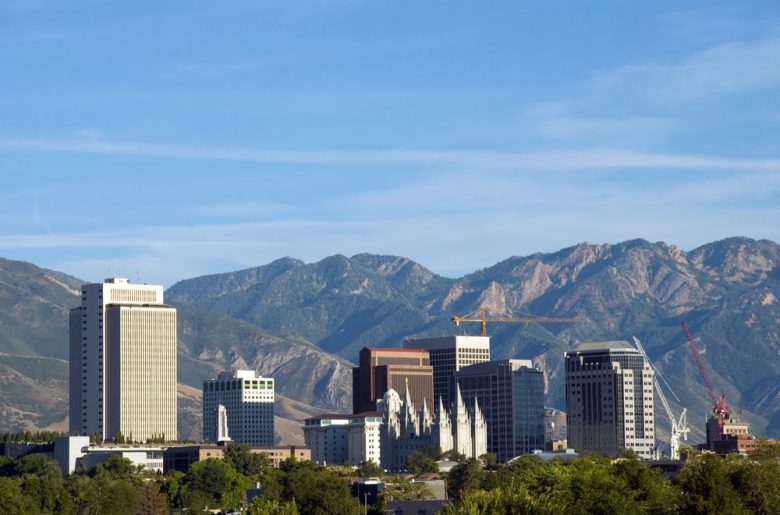
Median income: $79,000
Median loan amount: $285,000
Leverage ratio: 3.608
Image Credit: DepositPhotos.com.
2. Los Angeles
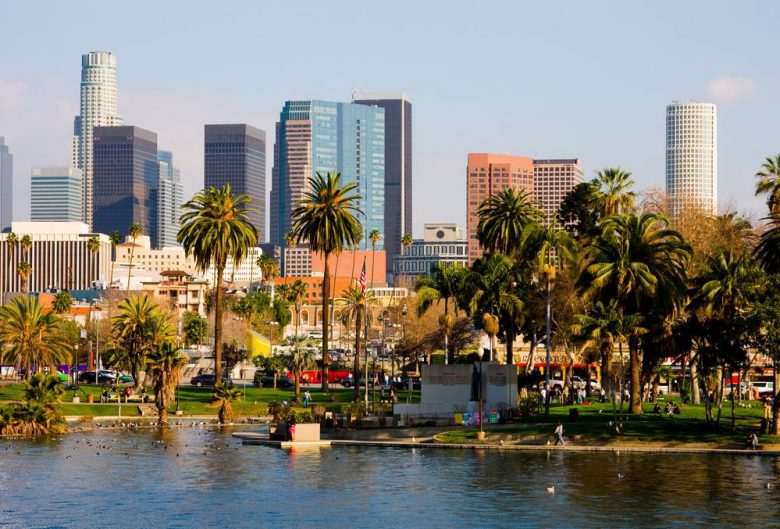
Median income: $138,000
Median loan amount: $505,000
Leverage ratio: 3.659
Image Credit: DepositPhotos.com.
1. San Diego, California
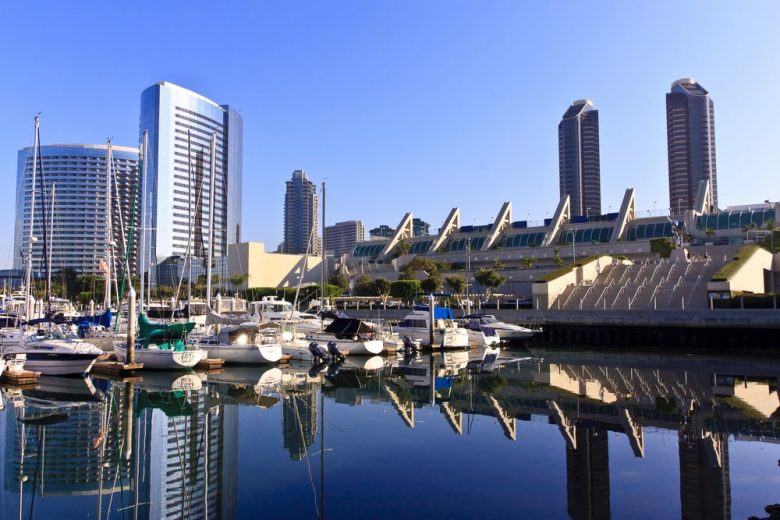
Median income: $128,000
Median loan amount: $485,000
Leverage ratio: 3.789
This article originally appeared on LendingTree.com and was syndicated by MediaFeed.org.
Image Credit: DepositPhotos.com.
AlertMe


