
Tornado frequency across the US varies, and some counties are in more danger than others.
As the 2025 peak tornado season begins, Home Gnome uncovered which U.S. counties are most at risk for tornado damage.
Using FEMA data, we analyzed nearly 950 counties with moderate to very high tornado risk. We considered six key factors, including tornado frequency, expected annual losses, average home age, and whether local building codes account for tornado resilience.
Image Credit: Bilanol/Istockphoto.
Top 5 Close Up

Cook County, Illinois
- 3 Biggest Cities: Chicago, Elgin, Cicero
- Overall Score: 77.47
- Tornado Risk Score: 99.97 | Rank: 2
- Average Age of Homes: 64 years | Rank: 59 (Tie)
- Share of Mobile Homes: 0.79% | Rank: 888
- State Adoption of International Residential and Building Codes: 0 | Rank: 1 (Tie)
- Total Expected Annual Loss from Tornadoes: $304 million | Rank: 3
- Average State Home Insurance Premium as % of Median Annual Income: 1.03% | Rank: 730 (Tie)
Image Credit: wikipedia.
St. Louis City, Missouri

- Overall Score: 74.00
- Tornado Risk Score: 98.6 | Rank: 45
- Average Age of Homes: 86 years | Rank: 1
- Share of Mobile Homes: 0.43% | Rank: 915
- State Adoption of International Residential and Building Codes: 0 | Rank: 1 (Tie)
- Total Expected Annual Loss from Tornadoes: $25 million | Rank: 55
- Average State Home Insurance Premium as % of Median Annual Income: 1.90% | Rank: 161 (Tie)
Image Credit: Sean Pavone/istockphoto.
Jackson County, Missouri

- 3 Biggest Cities: Kansas City, Independence, Lee’s Summit
- Overall Score: 71.87
- Tornado Risk Score: 99.59 | Rank: 14
- Average Age of Homes: 55 years | Rank: 155 (Tie)
- Share of Mobile Homes: 0.84% | Rank: 885
- State Adoption of International Residential and Building Codes: 0 | Rank: (Tie)
- Total Expected Annual Loss from Tornadoes: $54.5 million | Rank: 17
- Average State Home Insurance Premium as % of Median Annual Income: 1.90% | Rank: 161 (Tie)
Image Credit: Ryan Wewers/Istockphoto.
Harris County, Texas

- 3 Biggest Cities: Houston, Pasadena, Pearland
- Overall Score: 70.80
- Tornado Risk Score: 100 | Rank: 1
- Average Age of Homes: 37 years | Rank: 680 (Tie)
- Share of Mobile Homes: 2.56% | Rank: 749
- State Adoption of International Residential and Building Codes: 24 | Rank: 160 (Tie)
- Total Expected Annual Loss from Tornadoes: $354 million | Rank: 2
- Average State Home Insurance Premium as % of Median Annual Income: 1.35% | Rank: 370 (Tie)
Image Credit: SeanPavonePhoto/istockphoto.
Sedgwick County, Kansas

- 3 Biggest Cities: Wichita, Derby, Haysville
- Overall Score: 70.64
- Tornado Risk Score: 99.33 | Rank: 22
- Average Age of Homes: 48 years | Rank: 303 (Tie)
- Share of Mobile Homes: 3.18% | Rank: 695
- State Adoption of International Residential and Building Codes: 0 | Rank: 1 (Tie)
- Total Expected Annual Loss from Tornadoes: $46.5 million | Rank: 25
- Average State Home Insurance Premium as % of Median Annual Income: 1.88% | Rank: 204 (Tie)
You can check 2025’s most vulnerable counties for tornadoes full list here.
Image Credit: Jacob Boomsma/Istockphoto.
Key Findings
- Tornado Alley, in the central region of the U.S., sees the most tornado activity.
- Texas, Kansas, Oklahoma, Missouri, and Illinois average some of the highest tornado counts in the country, according to the National Weather Service Storm Prediction Center. Counties in these states dominate the top 100 most vulnerable counties, with 19 Texas counties, 8 Kansas counties, and 10 each from Oklahoma and Missouri, as well as 12 from Illinois.
- Between 1,300 and 1,450 tornadoes are predicted to hit the U.S. in 2025, according to AccuWeather, and as tornado trends are shifting east, states like Tennessee and Kentucky are increasingly at risk. 21 Tennessee counties and 11 Kentucky counties landed in the top half of the ranking.
- Some of the nation’s oldest housing stock increases tornado vulnerability in places like St. Louis City, Missouri (No. 2), and Philadelphia County, Pennsylvania (No. 90). Both counties face high expected financial losses due to dense populations and aging infrastructure.
- Despite being tornado-prone, Kansas, Missouri, and Illinois have not adopted standards from the International Residential Code or the International Building Code as statewide building standards. While some local jurisdictions use versions of the codes, adoption is inconsistent. The 2024 IBC includes new amendments focused on tornado resilience, addressing gaps in current building practices.
Image Credit: mixmotive/Istockphoto.
Regional Insights
The Northeast is the least tornado-prone region in the ranking, with only Philadelphia County (No. 90) making the top 100. However, the Northeast’s aging infrastructure and dense housing elevate the potential for severe damage when tornadoes occur.
The Midwest holds 14 of the top 20 counties. The region combines widespread tornado risk with an older housing stock, which increases damage costs.
The South is home to 47 of the top 100 most vulnerable counties, notably in Texas and Oklahoma, including the Texas triangle consisting of Harris County (No. 4), Dallas County (No. 21), Bexar County (No. 29), and Travis County (No. 49). High percentages of mobile and manufactured homes amplify the region’s vulnerability.
Most counties in the West have moderate tornado vulnerability.
However, Colorado displays multiple counties among the most vulnerable, including Denver County (No. 11) and El Paso County (No. 20). San Diego County, on the other hand, falls to the bottom, ranking second to last (No. 945).
Image Credit: Bilanol / iStock.
Counties With the Highest Expected Financial Loss
When tornadoes hit densely populated areas, damage costs soar. Texas dominates the top counties facing the highest potential financial losses from tornadoes, alongside Cook County, Illinois, home to Chicago.
- Collin County, TX (Plano, Frisco, McKinney) | Expected Loss: $358 million
- Harris County, TX (Houston, Pasadena, and Atascocita) | Expected Loss: 354 million
- Cook County, IL (Chicago, Elgin, Cicero) | Expected Loss: $304 million
- Denton County, TX (Denton, Lewisville, Flower Mound) | Expected Loss: $125 million (Tie)
- Tarrant County, TX (Fort Worth, Arlington, Mansfield) | Expected Loss: $125 million (Tie)
Image Credit: Bilanol/Istockphoto.
Methodology
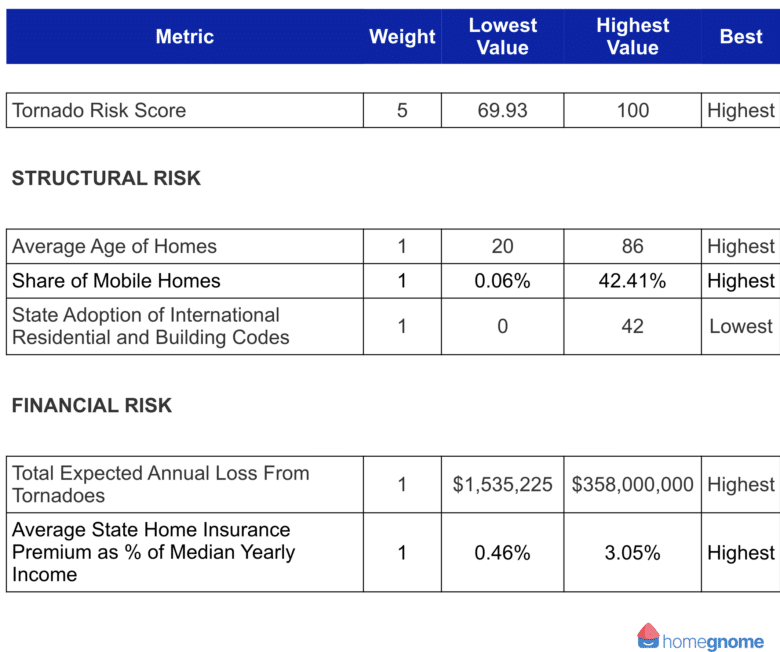
First, we determined the factors (metrics) that are most relevant to rank the Counties Most at Risk for Tornado Damage. We then assigned a weight to each factor based on its importance and grouped those factors into 3 categories:
- Incidence Risk
- Financial Risk
- Structural Risk
The categories, factors, and their weights are listed in the table below.
For each of the 946 counties with a relatively moderate to very high tornado risk according to FEMA, we then gathered data on each factor from the sources listed below the table.
Finally, we calculated scores (out of 100 points) for each county to determine its rank in each factor, each category, and overall. A county’s Overall Score is the average of its scores across all factors and categories. The highest Overall Score ranked “Most at Risk” (No. 1) and the lowest “Least at Risk” (No. 946).
Notes:
- The “Least at Risk” among individual factors may not be No. 946 due to ties.
- Some counties in our ranking use unique geographical designations. For example, St. Louis, Missouri, functions as both an independent city and a county, separate from St. Louis County. And in Louisiana, counties are known as “parishes.”
- Tornado Risk, calculated by FEMA, considers the annualized frequency of and exposure to tornadoes as well as social vulnerability and community resilience factors.
- Expected Annual Loss, calculated by FEMA, measures the financial impact of expected annual building and population loss due to tornadoes.
- For the “State Adoption of International Residential and Building Codes” metric, states were scored based on the year they adopted the IBC and IRC, and then summed. Higher totals reflect more up-to-date codes. A score of 0 indicates the codes were not applied as a statewide standard in 2024.
Image Credit: Federal Emergency Management Agency, International Code Council, U.S. Census Bureau, and Forbes.
Final Thoughts: Weathering the Storm
With 54% of all twisters occurring between April and June, peak storm season is no time to be caught unprepared. The U.S. typically sees around 1,200 tornadoes annually, but 2024 recorded 1,910, more than 700 above the annual average and one of the most active tornado years on record.
Yet nearly two-thirds of local governments have not adopted the latest building codes, leaving millions of homes and businesses exposed to preventable damage.
Even an EF-0 twister (winds under 85 mph) can tear off shingles, damage gutters and siding, break branches, and uproot some trees. As tornado intensity increases, from EF-1 to EF-5, the scale of destruction also multiplies.
Boost your home’s defense with some of these helpful tips:
- Inspect your roof after every storm and know what to do when damage strikes.
- Upgrade to impact-resistant materials, such as Class 4 shingles or metal roofing.
- Replace damaged flashing to prevent costly leaks.
- Set aside a roof repair fund, especially if you have solar panels or a chimney.
- If you live near the coast, prep your roof for hurricane season, too.
- Get an estimate on what a new roof might cost in your area.
Related: Top U.S. Counties Most at Risk for Hail Damage in 2025
Related: 2025’s Most Vulnerable States for Indoor Pests
This article originally appeared on Homegnome.com and was syndicated by MediaFeed.org
Image Credit: Bilanol/Istockphoto.
AlertMe


