
The Big Picture On The Best Cities for Real Estate Investment By GRM:
- As of the start of Q4 2024, the national average GRM in the U.S. stands at 13.78, though this figure varies significantly across different regions, highlighting the importance of local market analysis.
- Cities with lower GRMs often present better investment opportunities, as they suggest higher rental income relative to property prices, enhancing potential returns.
- Investors considering long-distance real estate investments might explore turnkey properties through platforms like Roofstock or Norada, which facilitate purchasing properties without needing in-person visits.
S. home prices went on quite a ride—going from $250,000 to $400,000 during the pandemic years before cooling off in late 2022.
By the end of Q3 2024, U.S. median home prices were at $420,400, roughly a 3% decrease from last year. This compares with the annual pace of 3.13% seen in 2023 and is more normal than the frothy 7.45% growth in 2022. Over the last year, however, over 100 cities across the U.S. saw cooling home prices.
While certain cities have seen price declines, the national median home price has remained relatively stable, with slight fluctuations.
All that said, some cities offer far better yields than others. Investors looking for cities with the best price-to-rent ratio should pay close attention to local market dynamics. Below, you’ll find the top 300 cities in the U.S. by population, mapped with their GRM, median rent, and median home price.
What Is GRM (Gross Rent Multiplier)
Gross rent multiplier is one of those real estate terms that sounds more complicated than it is. It’s actually one of the easiest concepts in real estate investing.
Quite simply, the gross rent multiplier is the ratio between a home’s price and gross annual rental income. Just divide the price by the gross annual rents, and you get the ratio:
GRM = Price of Property/Gross Annual Rental Income
For example, if a property costs $150,000 and it generates a gross rental income of $15,000 per year, the GRM is 10 ($150,000 / $15,000 = 10). Lower is better for GRM, indicating higher rents and lower prices.
Here’s a quick GRM calculator in case you don’t love math:
GRM Calculator
Use this free GRM calculator to run GRM for any property or city.
Another way to think of GRM is the number of years it would take for a property to pay for itself in gross rent. If a property generates $15,000 per year and costs $150,000 to buy, it would take 10 years to pay for itself, not including expenses.
This makes an important point: GRM doesn’t include expenses the way cap rates do. That makes it a simpler—but less accurate—calculation.
What Do GRM Numbers Tell You?
Generally, a GRM below 10 suggests strong rental income relative to purchase price, while numbers above 13 warrant careful analysis.
Best Cities for Real Estate Investing by GRM
The following map shows the top 300 cities in the country by population:
Note that many smaller cities and towns in the US have higher cap rates. These are simply the 300 most populated U.S. cities I used because Zillow makes this data easily available.
While home prices shot upward in the pandemic and rents held steady during the eviction moratorium, rents later leaped to catch up to soaring home prices. In many markets, rents shot up faster than the market fundamentals and have since drifted back down to earth.
Nationwide, the average gross rent multiplier in the U.S. is 13.78 at the end of the third quarter of 2024. However, this figure varies significantly across different regions, with some cities with the lowest price-to-rent ratio offering particularly attractive investment opportunities.
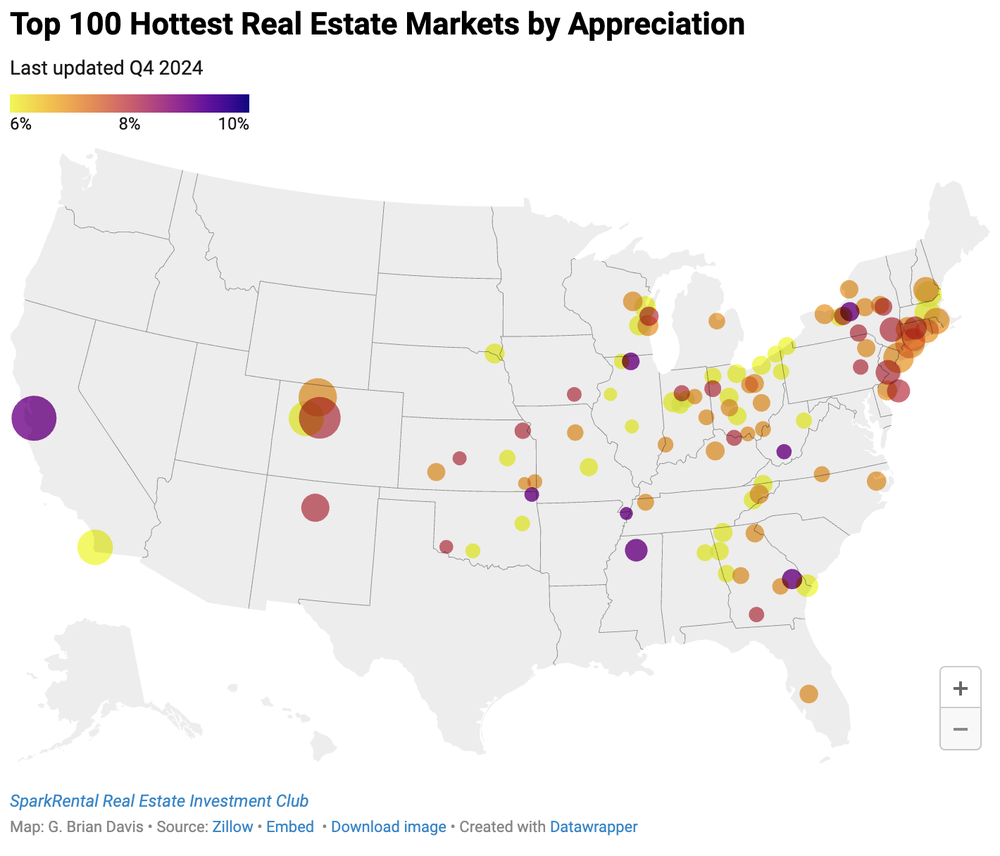
Top 100 Fastest Appreciating Cities in the US
Where are home prices rising the fastest?
Most of these are smaller cities or towns or satellite towns near larger metropolitan areas.
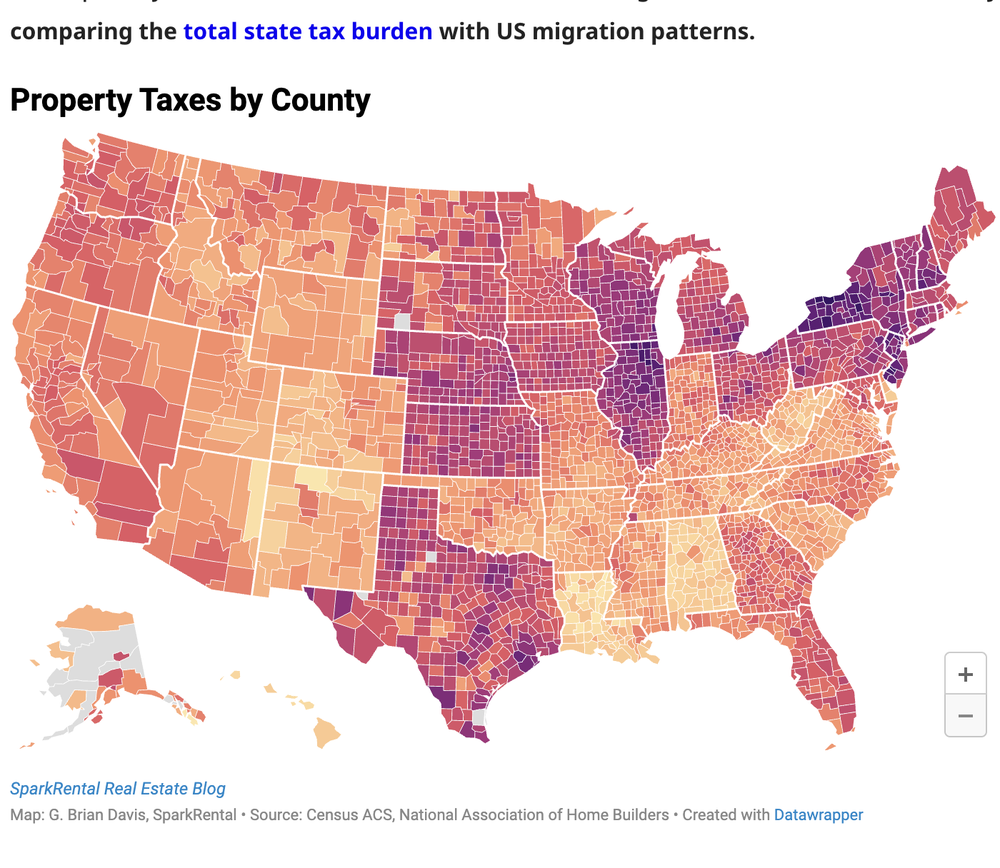
Property Taxes by County
Property taxes aren’t your only ongoing expense as a real estate investor, but they can impact your bottom line. Especially in areas with other high taxes (like income and sales taxes) and especially in states where more Americans are moving out than in. See our data analysis comparing the total state tax burden with US migration patterns.
Investment Approaches for Different Market GRMs
Although GRM helps identify promising markets, different cities call for different investment strategies. Buy-and-hold strategies often work well in markets with low GRMs (4-10) since strong cash flow can help weather market fluctuations. Investors in these areas typically focus on single-family homes and small multi-family properties because they tend to offer the best balance of management overhead and returns.
For markets showing higher GRMs (11-13), investors might consider value-add strategies to boost returns. This could mean purchasing properties that need moderate renovation to increase rents and property value. In these markets, multi-family properties often make more sense as they allow investors to spread costs across multiple units.
Markets with GRMs above 14 generally require more creative approaches. These might include house hacking (where you live in one unit while renting others) or focusing on luxury rentals where premium rents can offset high acquisition costs. Some investors in these waters also explore commercial properties or mixed-use developments, which often operate under different pricing dynamics than purely residential properties.
Understanding Market Fundamentals Beyond GRM
The most successful real estate investments often align with strong economic indicators and positive demographic trends. We’re talking about:
- Job markets (and not just one big employer – you want diversity)
- Population trends (especially those rental-loving millennials and Gen Zs)
- Huge developments coming to town (new transit lines or something similar)
The reality is that some markets look amazing on paper with their low GRMs, but dig deeper, and you might find they’re one-factory towns or losing population faster than a leaky faucet loses water. On the flip hand, some “expensive” markets with high GRMs might actually be worth every penny because they’re growing like crazy with new jobs and infrastructure projects.
In simple terms, what works in Austin might bomb in Buffalo, even if the GRM numbers look similar. Use the GRM data above as your starting point, but don’t stop there. Your best bet is to match your strategy to what’s happening in your target cities.
Final Thoughts
Gross rent multiplier doesn’t tell you the whole story about the best places to invest in real estate. No one data point can.
But GRM does help you find cities with relatively higher rents and lower home prices. It can help you identify promising cities to start your hunt for ideal neighborhoods and stellar deals on rental properties.
This article originally appeared on SparkRental.com and was syndicated by MediaFeed.org
More from MediaFeed:
What Happens If I Don’t Pay Taxes?

Not paying your taxes can lead to significant consequences. The IRS may charge penalties and interest on unpaid amounts, which could increase your debt over time.
You may also face enforcement actions like liens on your property, wage garnishment, or even legal action. In cases of intentional tax evasion, the consequences may include fines or, in rare instances, jail time.
Whether we like it or not, taxes are a fact of life in the United States. But what happens if you miss the tax deadline or can’t afford to pay what you owe? It’s important to understand the potential consequences of not paying taxes, both immediate and long-term.
In this article, we’ll explain what happens if you don’t pay your taxes on time and what options you have to get back on track, including various tax relief services that may help.
Liubomyr Vorona/Istockphoto

Missing a tax deadline or not paying your taxes in full can lead to certain penalties and interest on what’s owed. These charges may increase over time, making it more challenging to manage. Some of the penalties and interest you may face include:
-
Failure to Pay Penalty: The IRS charges a Failure to Pay Penalty for any unpaid taxes due, and the longer you wait to file, the bigger the penalty. The penalty is 0.5% of the unpaid tax for every month (or part of a month) that the taxes are left unpaid, up to a maximum of 25%.
-
Failure to File Penalty: Filing your tax return and paying your taxes are separate requirements. The IRS charges a Failure to File Penalty when you don’t file your tax return by the due date. As with the Failure to Pay Penalty, it grows over time. The penalty is 5% of unpaid taxes due for each month (or part of a month) that the return is late, up to a maximum of 25%.
-
Both Filing and Late Payment: If both the payment and filing penalties are applied in the same month, the Failure to File penalty is reduced by the amount of the Failure to Pay penalty, for a combined penalty of 5% per month.
-
Interest on Penalties:The IRS charges interest on penalties, and the interest rate is adjusted quarterly. So the longer taxes and penalties remain unpaid, the more you’ll owe.
Ridofranz/istockphoto

Neglecting your tax obligations can have both short- and long-term effects. Some of the potential long-term consequences of not paying taxes include:
-
Wage Garnishments:If you have a job and get paid via a Form W-2, the IRS can take money directly out of your paycheck—before you even receive it—to cover your debt. This may reduce your take-home pay.
-
Tax Liens:The IRS can place a lien on your property, such as your car, TV, furniture, etc., which means they have a legal claim on these items. If necessary, they can even repossess them to cover the debt.
-
Bank Levies:The IRS can freeze your bank account and seize funds to cover unpaid tax bills.
-
Passport Revocation:In rare instances, if your tax debt remains unresolved, the IRS may revoke your passport, limiting your ability to travel abroad
Ridofranz/istockphoto

If you think the above situations sound a bit harsh, there’s a reason for them—you’re legally required to pay taxes if you make enough money to owe them.
Taxes apply to most types of income, including wages from a W-2 or 1099, capital gains from your investments, rental income, and more.These taxes can be paid through automatic withholding from your paychecks (for W-2 employees) or by making quarterly estimated tax payments (for independent contractors or those receiving Form 1099s).
If taxes go unpaid, the IRS may apply penalties and interest. In some cases, they can also take further actions, such as seizing assets or garnishing wages.
fizkes / istockphoto

The IRS has various enforcement tools designed to collect unpaid taxes efficiently.
If you’re behind on taxes, the IRS will typically send a letter or notice indicating that they haven’t received your tax return, tax payment, or both. These notices often provide a time frame—such as 30 days—for you to respond, though not all require a response. When filing or paying taxes after receiving a notice, you may need to include an explanation (if the notice requires a response).
The IRS may also perform a tax audit, which involves contacting you to examine your tax return and financial records. This could either result in the IRS changing its opinion or further enforcement efforts.
Finally, the IRS might assign a tax collection officer to your case. These officers can take legal action to collect the debt, including seizing assets or garnishing wages
designer491/istockphoto

In most cases, failing to pay your taxes or file your tax return is treated as a civil matter, typically leading to penalties, interest, and collection actions. However, in instances of intentional tax evasion—when someone deliberately avoids paying taxes—the IRS may pursue criminal charges. This can result in significant fines and, in rare cases, potential jail time.
Ridofranz/istockphoto

If you find yourself in a situation where you neglect to file your tax return, pay your taxes, or both, don’t panic. (Even if you’re hoping to find the best tax relief services!) There are several steps you can take to resolve the issue, including:
-
File your Tax Return ASAP:If it’s after the due date and you haven’t filed your return, do so as soon as possible, even if you can’t pay your full tax bill immediately.
-
Contact the IRS:If you’re struggling to pay your tax bills, you can reach out to the IRS to discuss your situation. They may offer manageable payment plans, potential reductions in tax debts, or other options to help you manage your debt and pay what you can.
-
Consider a Payment Plan: The IRS may work with you to set up a payment plan that allows you to gradually reduce your tax debt. You’ll need to provide documentation to support your ability to make payments, such as proof of income, expenses, and assets.
-
Consider Contacting a Tax Resolution Professional:There are many professional tax resolution experts who specialize in helping individuals resolve tax debts. They can help you negotiate with the IRS and find a solution that fits your situation.
damircudic/istockphoto

Failing to file or pay your taxes can lead to consequences such as penalties, interest, asset seizure, and, in rare cases, criminal charges. By understanding your obligations, filing tax returns on time, paying your tax debts, and considering help from a tax relief service, you may avoid these challenges and maintain a healthier financial situation
This article originally appeared on Thectoclub.com and was syndicated by MediaFeed.org
Jacob Wackerhausen/istockphoto

Ngampol Thongsai/Istockphoto
Featured Image Credit: gorodenkoff/istockphoto.
AlertMe


