The price of gasoline in the United States is climbing once more as markets remain in turmoil following Russia’s invasion of Ukraine. Additionally, the Biden administration’s embargo on Russian oil has been identified as a factor causing drivers even more pain at the pump.
 You will find more infographics at Statista
As of early May 12, website Gasbuddy put the price of a gallon of regular at $4.42 in the U.S. on average. That price is above the new all-time high recorded by the Energy Information Administration on May 9 ($4.33) and is also Gas Buddy’s own record. The U.S. average price is only published once a week by the EIA.
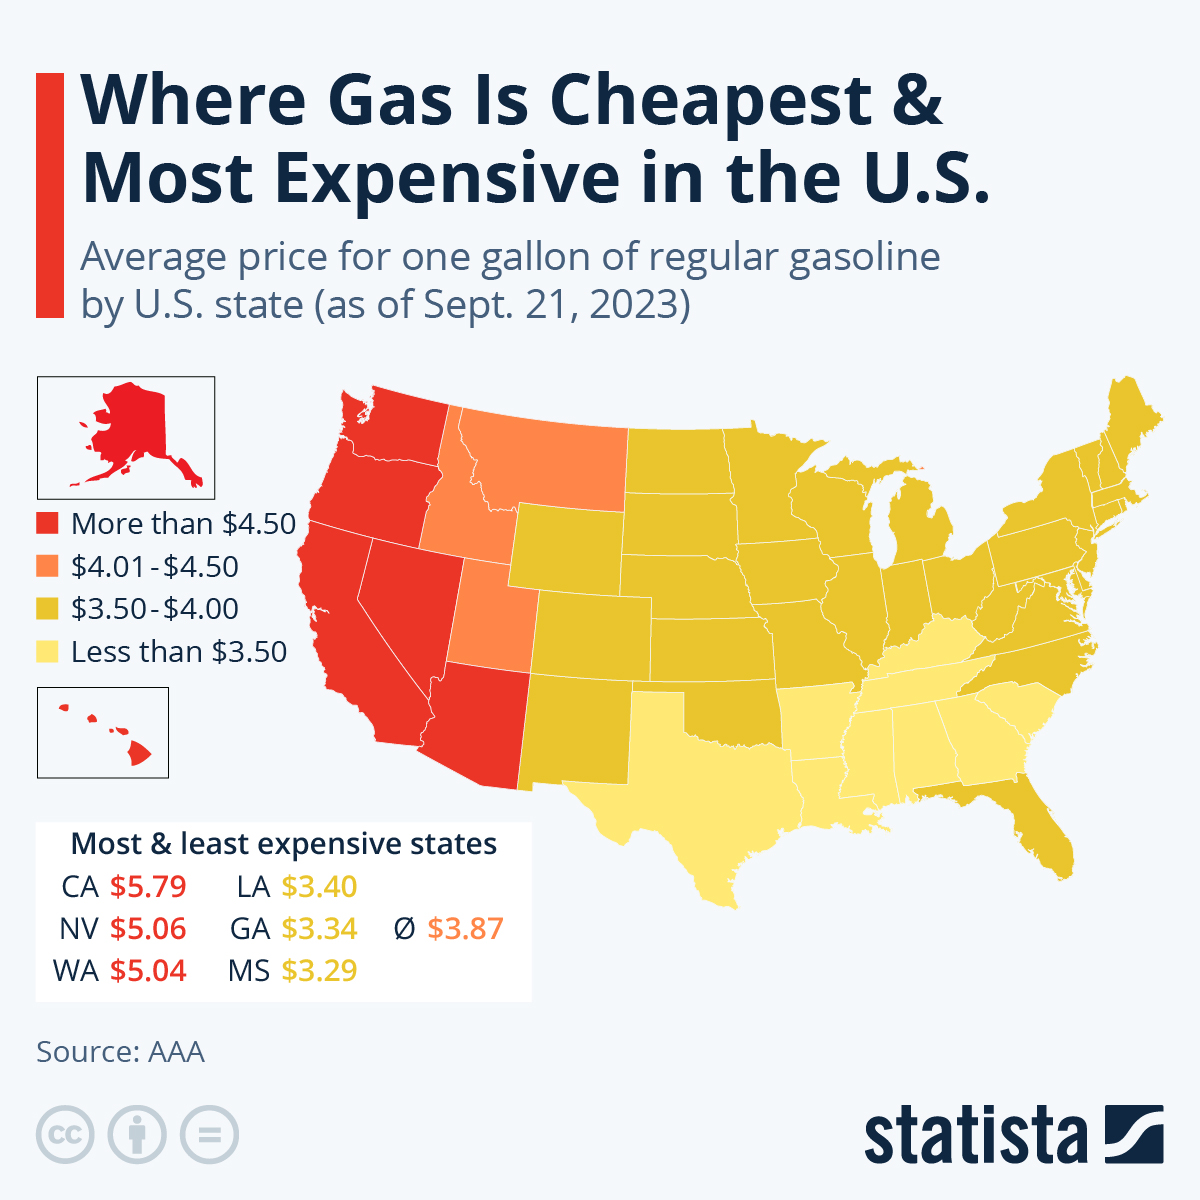
Gas prices also vary widely across the United States. State-specific costs for transportation and distribution can drive up prices, like in the case of Alaska and Hawaii. State taxes also vary greatly, for example explaining the high price of gasoline in California.
SPONSORED: Find a Qualified Financial Advisor
1. Finding a qualified financial advisor doesn’t have to be hard. SmartAsset’s free tool matches you with up to 3 fiduciary financial advisors in your area in 5 minutes.
2. Each advisor has been vetted by SmartAsset and is held to a fiduciary standard to act in your best interests. If you’re ready to be matched with local advisors that can help you achieve your financial goals, get started now.
States that usually offer cheap gas, however, are also feeling the price crunch right now. According to Gasbuddy, the gallon now costs upwards of $4.00 on average in Texas, while also surpassing that threshold in Missouri, South Carolina and Louisiana.
In only five states, the gallon still cost below $4.00, all of them located in the Midwest or Southern United States. Among those shelling out most for gas at the moment were residents of Oregon, Washington, Nevada and the Northeastern states.
This article originally appeared on Statista.com and was syndicated by MediaFeed.org.
More from MediaFeed:
The worst drivers in America live here

Plenty of Americans like to complain that their city has the worst drivers. In fact, doing so is something of a national pastime. After all, grumbling that no one on the road knows how to drive is a relatively harmless way to blow off steam during stressful daily commutes.
Recently, drivers have had even more to complain about, as rates of dangerous driving behavior, including speeding, are on the rise across America. Many motorists picked up bad driving habits during the COVID-19 pandemic’s initial shelter-in-place orders, and unfortunately, have continued those dangerous practices into 2022.
While not all moving violations are equally hazardous, every infraction — from improper backing to reckless driving — represents some level of neglect for the rules of the road. Curious to see where drivers break traffic laws most often, the data scientists at Insurify turned to their database of over 4.6 million car insurance applications to identify the city in each state with the worst drivers in 2022.
tommaso79 / iStock

- National averages. Across the U.S., 17.2% of drivers have an at-fault violation on record. For context, this is about the same proportion of U.S. men standing 6’2” or taller, or U.S. women standing 5’6” or taller.
- In top cities, bad driving rates are soaring. Among the worst driving cities in the nation, an average of 20.7% of drivers have a prior at-fault violation. In the top ten worst driving cities in the country, this share rises to a whopping 25.4%, or more than 1 out of every 4 drivers. Drivers in these cities are cited for at-fault traffic violations 48% more often than the national average. Ohio has higher rates of poor driving than any other state; four of the state’s metro areas rank among the nation’s ten worst driving cities. Canton, Ohio, has the highest traffic infraction rate in the nation.
- Which city has the best drivers? Bragging rights go to Waterbury, Connecticut, which has the lowest traffic infraction rate of any city in the U.S. Only 10.3% of Waterbury drivers have a prior traffic violation on record, a share that’s 40% lower than the national average. Connecticut has two additional cities, Bridgeport and New Haven, among the 10 safest driving cities in the country. Even the state’s worst driving city — Hartford — still has an at-fault infraction rate that’s 21% lower than the national average.
Here is the city with the worst drivers by state.
Note: Due to insufficient metropolitan area data, Alaska, Maine, Montana, New Hampshire, North Dakota, Rhode Island, Vermont, and Wyoming were excluded from this analysis.
Insurify

- Share of drivers with an at-fault violation on record: 22.1% (10% greater than state average)
DepositPhotos.com

- Share of drivers with an at-fault violation on record: 19.8% (18% greater than state average)
Christopher Harris / iStock

- Share of drivers with an at-fault violation on record: 20.7% (20% greater than state average)
Brandonrush / Wiki Commons

- Share of drivers with an at-fault violation on record: 22.4% (28% greater than state average)
Jamesb01 / Wiki Commons

- Share of drivers with an at-fault violation on record: 24.1% (13% greater than state average)
marekuliasz / iStock

- Share of drivers with an at-fault violation on record: 13.6% (19% greater than state average)
DepositPhotos.com

- Share of drivers with an at-fault violation on record: 18.4% (22% greater than state average)
Deposit Photos

- Share of drivers with an at-fault violation on record: 20.9% (42% greater than state average)
Deposit Photos

- Share of drivers with an at-fault violation on record: 22.0% (10% greater than state average)
istockphoto

- Share of drivers with an at-fault violation on record: 16.3% (5% greater than state average)
Ingus Kruklitis/istockphoto

- Share of drivers with an at-fault violation on record: 26.4% (18% greater than state average)
Sean Pavone/istockphoto

- Share of drivers with an at-fault violation on record: 17.0% (13% greater than state average)
Alexbaumgarner / iStock

- Share of drivers with an at-fault violation on record: 21.8% (10% greater than state average)
Wiki Commons

- Share of drivers with an at-fault violation on record: 25.6% (19% greater than state average)
dangarneau / istockphoto

- Share of drivers with an at-fault violation on record: 22.0% (8% greater than state average)
Deposit Photos

- Share of drivers with an at-fault violation on record: 17.7% (22% greater than state average)
Jacqueline Nix / istockphoto

- Share of drivers with an at-fault violation on record: 17.0% (13% greater than state average)
artiste9999 / iStock

- Share of drivers with an at-fault violation on record: 19.5% (2% greater than state average)
krblokhin / iStock

- Share of drivers with an at-fault violation on record: 19.8% (9% greater than state average)
DepositPhotos.com

- Share of drivers with an at-fault violation on record: 14.9% (22% greater than state average)
Sean Pavone / iStock

- Share of drivers with an at-fault violation on record: 17.4% (2% greater than state average)
DepositPhotos.com

- Share of drivers with an at-fault violation on record: 15.2% (8% greater than state average)
Woodlot

- Share of drivers with an at-fault violation on record: 22.5% (22% greater than state average)
Sean Pavone / istockphoto

- Share of drivers with an at-fault violation on record: 27.8% (21% greater than state average)
Deposit Photos

- Share of drivers with an at-fault violation on record: 17.8% (36% greater than state average)
gchapel / iStock

- Share of drivers with an at-fault violation on record: 13.8% (12% greater than state average)
Famartin / Wiki Commons

- Share of drivers with an at-fault violation on record: 17.7% (26% greater than state average)
dherrera_96 / Flickr

- Share of drivers with an at-fault violation on record: 20.1% (43% greater than state average)
Brian Logan / iStock

- Share of drivers with an at-fault violation on record: 20.1% (5% greater than state average)
istockphoto/Mark Howard

- Share of drivers with an at-fault violation on record: 28.2% (14% greater than state average)
benkrut / iStock

- Share of drivers with an at-fault violation on record: 19.8% (15% greater than state average)
raksyBH / istockphoto

- Share of drivers with an at-fault violation on record: 23.9% (14% greater than state average)
thyegn / iStock

- Share of drivers with an at-fault violation on record: 17.3% (12% greater than state average)
DepositPhotos.com

- Share of drivers with an at-fault violation on record: 24.9% (11% greater than state average)
Kruck20 / istockphoto

- Share of drivers with an at-fault violation on record: 23.9% (10% greater than state average)
Geoff Eccles / istockphoto

- Share of drivers with an at-fault violation on record: 21.3% (10% greater than state average)
Jugarum of English Wikipedia

- Share of drivers with an at-fault violation on record: 20.4% (33% greater than state average)
Michael Barera / Wiki Commons

- Share of drivers with an at-fault violation on record: 21.5% (9% greater than state average)
planetary_nebula / Wiki Commons

- Share of drivers with an at-fault violation on record: 23.9% (7% greater than state average)
DenisTangneyJr / istockphoto

- Share of drivers with an at-fault violation on record: 22.9% (12% greater than state average)
ChrisBoswell / istockphoto

- Share of drivers with an at-fault violation on record: 15.4% (7% greater than state average)
Sean Pavone / istockphoto

- Share of drivers with an at-fault violation on record: 22.8% (2% greater than state average)
istockphoto

Researchers at Insurify, a site to compare auto insurance rates, turned to their database of over 4.6 million car insurance applications to identify the U.S. cities with the worst drivers in 2022. For every metropolitan area with at least 50,000 residents — the U.S. Census Bureau’s definition of an urban area — Insurify’s data scientists compared the number of drivers with a prior at-fault moving violation on record within the last seven years against the overall driving population. The city in each state with the largest share of drivers with an at-fault violation on record was deemed the worst driving city in its respective state in 2022. For states with data on fewer than two cities with a population greater than 50,000, the two largest cities were considered in this analysis.
Due to insufficient metropolitan area data, Alaska, Maine, Montana, New Hampshire, North Dakota, Rhode Island, Vermont, and Wyoming were excluded from this analysis.
Population data for each metro area was gathered from the United States Census Bureau.
The findings in this article represent statistical trends found in Insurify’s analysis of over 4.6 million car insurance applications. The findings of this study are not meant to imply the direction nor necessarily the existence of a causal relationship. Rather, this is a presentation of statistical correlations of public interest.
This article originally appeared on Insurify.com and was syndicated by MediaFeed.org.
tommaso79 / istockphoto

DepositPhotos.com
Featured Image Credit: DepositPhotos.com.
AlertMe