
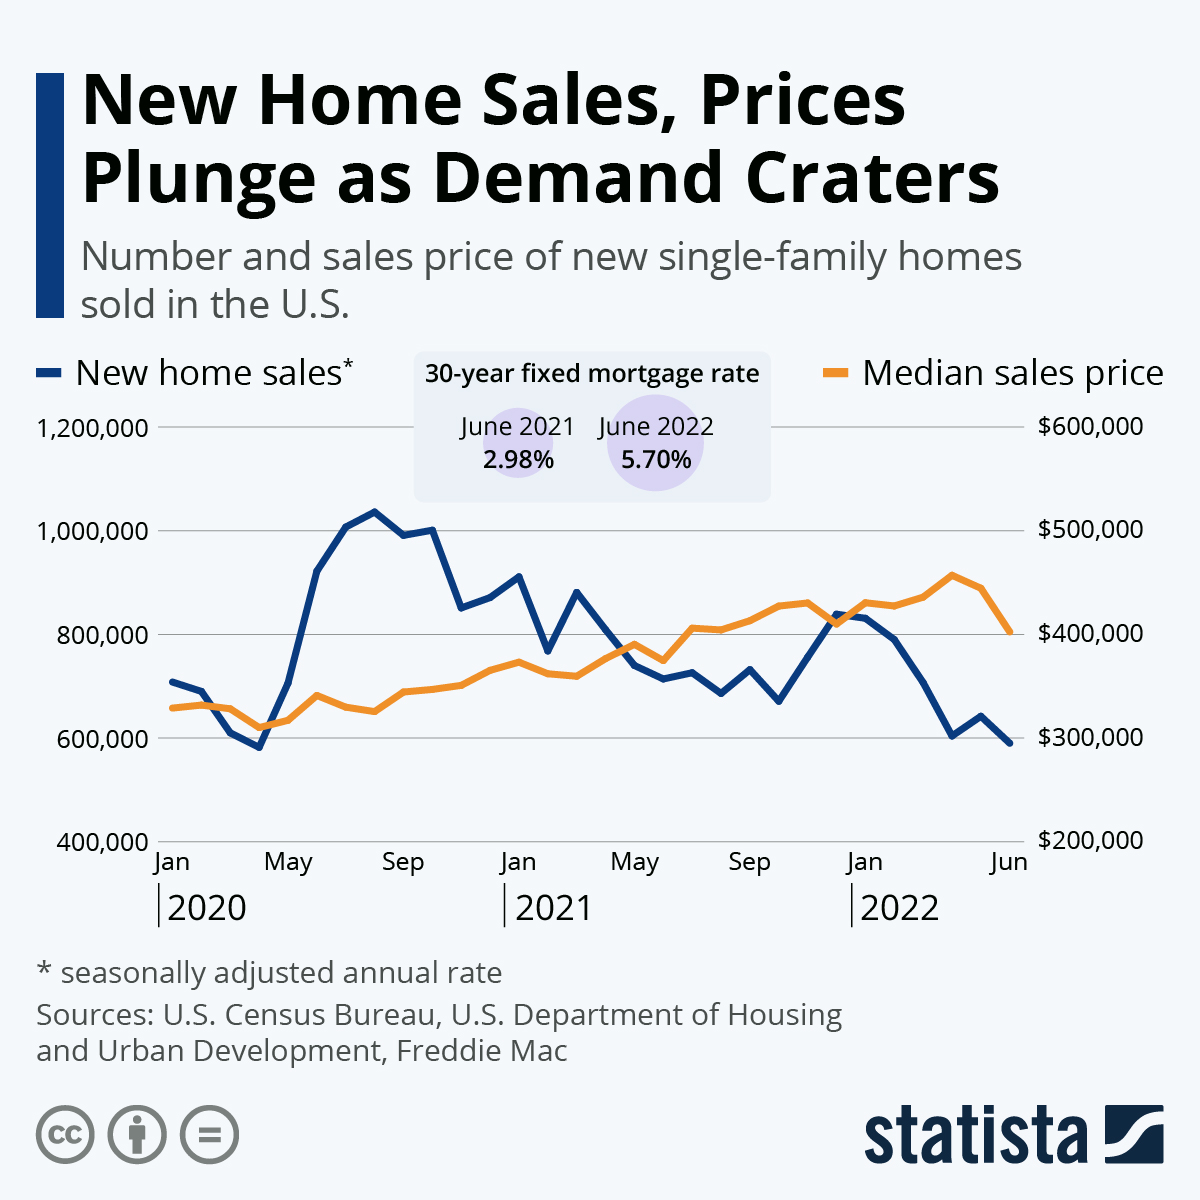
Sales of new single-family houses dropped for the fourth consecutive month in the United States, as potential home buyers face a perfect storm of unfavorable conditions.
According to figures jointly released by the U.S. Census Bureau and the U.S. Department of Housing and Urban Development, new home sales fell to a seasonally adjusted annual rate of 591,000 in April, the lowest it’s been since April 2020, when the Covid-19 pandemic left markets flooded with uncertainty.
 You will find more infographics at Statista
As new home sales dropped 16.6 percent in April, house prices continued their relentless upward trend. The median price of new houses sold in April climbed to an all-time high of $450,600, up 20 percent from a year ago and more than 45 percent from April 2020.
With the average sales price even higher than that at $570,300 and mortgage rates that have surged by more than two percentage points since the start of the year, many prospective buyers are effectively priced out of the market.
According to George Ratiu, Senior Economist and Manager of Economic Research at Realtor.com, today’s buyers face monthly mortgage payments that are $720 higher than a year ago, and that is on top of non-housing costs of living that have increased significantly amid the inflation surge in recent months.
This article originally appeared on Statista.com and was syndicated by MediaFeed.org.
More from MediaFeed:
These cities are where renters are getting squeezed most

After nearly two years of pandemic-deflated rental prices in America’s biggest cities, rent values are back on the rise. In fact, rent costs across the country are now at an all-time high, with price hikes not only widespread, but steep, too.
There are several factors behind this sharp rise in rent costs. For one, some people are feeling more comfortable with city life now that local governments have lifted many COVID-19 restrictions, and demand for rental units has rebounded in most U.S. metropolitan areas.
Inflation, which hit a 40-year high of 7.9% in February, is also contributing to the country’s steep rise in rental prices. Lastly, many potential homebuyers are temporarily turning to the rental options as they wait for the housing market to cool off from its current scorching state.
Curious to see where rental values have increased the most over the past year, the data science team at Insurify turned to national rent data to identify the 20 cities with the greatest rise in rent prices in 2022.
Prostock-Studio / iStock

- National averages. Across the U.S., rent values rose a staggering 17.5% between February 2021 and February 2022. The average apartment in an American city now rents for $1,574 per month, up from $1,339 in early 2021, meaning the typical renter is paying $235 more in rent every month.
- Rental frenzy in Florida. Cities in the southern U.S. are seeing rental values skyrocket in early 2022, and no state has more hot markets than Florida. The Sunshine State is home to the top nine metro areas where rent values are rising the fastest in 2022. Rental values in the state have risen a whopping 30.4% in the past year, and the average Florida apartment now costs $1,794 per month, which is 1.14 times more expensive than the national average.
- Few affordable safe havens. Out of the 177 metropolitan areas surveyed in this study, fewer than 10% saw their average rental prices increase by less than February 2022’s inflation rate of 7.9%. Most of these locations are smaller cities located in either Texas or the Upper Midwest, and only one of them — Grand Forks, North Dakota— experienced decreasing rental values over the past year.
Insurify

- Increase in overall rent value 2021-2022: 24.4%
- Median rent cost (February 2022): $1,430
- Population: 381,623
- Percentage of renters: 54.6%
istockphoto

- Increase in overall rent value 2021-2022: 24.7%
- Median rent cost (February 2022): $1,219
- Population: 449,937
- Percentage of renters: 47.2%

- Increase in overall rent value 2021-2022: 25.2%
- Median rent cost (February 2022): $1,686
- Population: 148,917
- Percentage of renters: 34.9%
Deposit Photos

- Increase in overall rent value 2021-2022: 25.3%
- Median rent cost (February 2022): $1,520
- Population: 1,475,386
- Percentage of renters: 41.5%
DepositPhotos.com

- Increase in overall rent value 2021-2022: 25.4%
- Median rent cost (February 2022): $1,633
- Population: 576,808
- Percentage of renters: 31.3%
hekopmylife / istockphoto

- Increase in overall rent value 2021-2022: 25.7%
- Median rent cost (February 2022): $1,639
- Population: 210,558
- Percentage of renters: 28.6%
Deposit Photos

- Increase in overall rent value 2021-2022: 25.8%
- Median rent cost (February 2022): $1,640
- Population: 2,141,574
- Percentage of renters: 47.7%
DepositPhotos.com

- Increase in overall rent value 2021-2022: 26.5%
- Median rent cost (February 2022): $1,342
- Population: 282,994
- Percentage of renters: 44.3%
Jugarum of English Wikipedia

- Increase in overall rent value 2021-2022: 27.5%
- Median rent cost (February 2022): $1,729
- Population: 4,673,634
- Percentage of renters: 45.9%
DepositPhotos.com

- Increase in overall rent value 2021-2022: 27.6%
- Median rent cost (February 2022): $1,283
- Population: 868,499
- Percentage of renters: 53.8%
DepositPhotos.com

- Increase in overall rent value 2021-2022: 27.8%
- Median rent cost (February 2022): $1,243
- Population: 265,728
- Percentage of renters: 49.7%
Hundley_Photography / iStock

- Increase in overall rent value 2021-2022: 28.3%
- Median rent cost (February 2022): $1,718
- Population: 2,450,261
- Percentage of renters: 63.8%
istockphoto/SeanPavonePhoto

- Increase in overall rent value 2021-2022: 29.3%
- Median rent cost (February 2022): $1,737
- Population: 266,595
- Percentage of renters: 40.9%
krblokhin / iStock

- Increase in overall rent value 2021-2022: 30.2%
- Median rent cost (February 2022): $1,415
- Population: 668,671
- Percentage of renters: 45.2%
Sean Pavone / istockphoto

- Increase in overall rent value 2021-2022: 30.6%
- Median rent cost (February 2022): $2,022
- Population: 6,070,944
- Percentage of renters: 66.7%
espiegle/istockphoto

- Increase in overall rent value 2021-2022: 30.7%
- Median rent cost (February 2022): $1,722
- Population: 3,030,047
- Percentage of renters: 48.7%
Gabriele Maltinti / istockphoto

- Increase in overall rent value 2021-2022: 38.6%
- Median rent cost (February 2022): $1,741
- Population: 718,679
- Percentage of renters: 32.4%
DepositPhotos.com

- Increase in overall rent value 2021-2022: 40.4%
- Median rent cost (February 2022): $2,067
- Population: 463,172
- Percentage of renters: 26.1%
felixmizioznikov / iStock

- Increase in overall rent value 2021-2022: 46.5%
- Median rent cost (February 2022): $2,129
- Population: 785,997
- Percentage of renters: 28.1%
DepositPhotos.com

- Increase in overall rent value 2021-2022: 51.6%
- Median rent cost (February 2022): $2,236
- Population: 363,922
- Percentage of renters: 25.8%
Sean Pavone / istockphoto

The data scientists at Insurify, a site to compare home insurance, referred to Apartment List price estimates to determine the cities with the greatest rent value increases in 2022. Apartment List is an online rental platform that releases monthly cost data for rental housing units in metropolitan areas across the United States.
To calculate the relative change in average rent prices over the past year, Insurify’s analysts first averaged median contract rental values for new leases signed during January and February of 2021 and January and February of 2022.
Researchers then took the percent change in price between these two averages to determine how much rental values have changed in each city over the past year.
This study considers the 177 largest metro areas in the United States for which Apartment List has available rental data. The percentage of renters in each city comes from Governing.com.
The findings in this article represent statistical trends found in Insurify’s analysis of national rental price data. The findings of this study are not meant to imply the direction nor necessarily the existence of a causal relationship. Rather, this is a presentation of statistical correlations of public interest.
This article originally appeared on Insurify.com and was syndicated by MediaFeed.org.
fizkes / iStock

Deagreez/istockphoto
Featured Image Credit: DepositPhotos.com.
AlertMe


