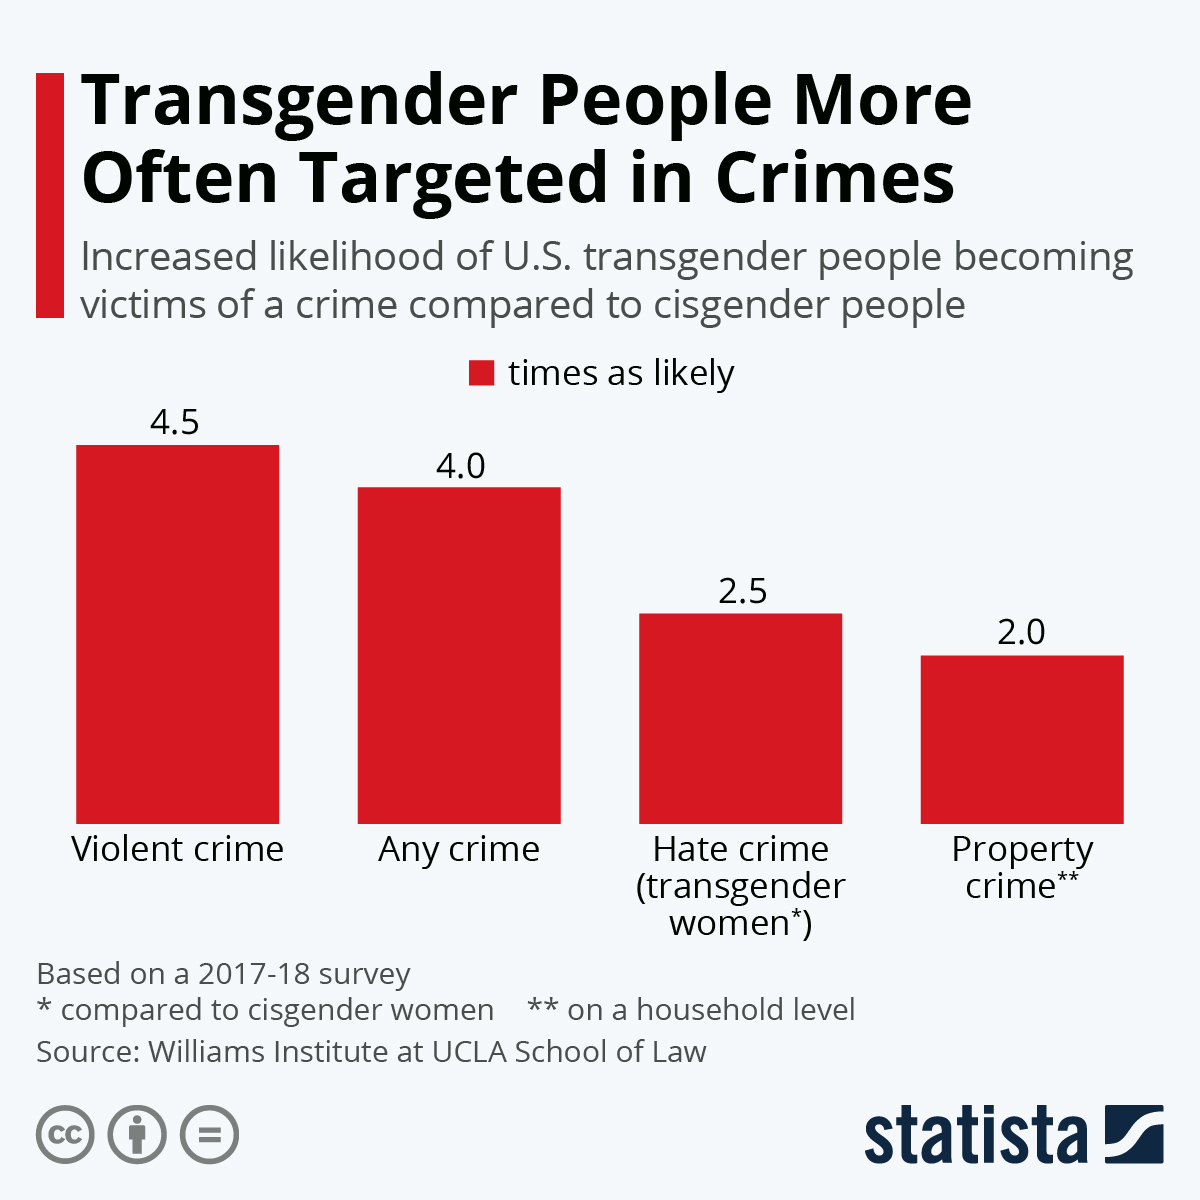
Transgender people in the United States are four times more likely to be the victim in a crime than cisgender people, research out of the Williams Institute at the University of California Los Angeles School of Law shows.
This staggering statistic shows the hostilities and barriers transgender people continue to face in their everyday lives.
 You will find more infographics at Statista
Violent crime was the type of crime most acutely affecting transgender people, with members being 4.5 times as likely to be the victim of a violent crime than cisgender people. Transgender women in particular were also more often targeted in hate crimes than cisgender women: 2.5 times as often.
These rates show the high degree of aggression brought towards the transgender community, both because many members are still pushed outside of mainstream society (for example, working in inherently dangerous professions) as well as because transgender people are actively targeted for of their identity.
Even property crimes, for example vandalism and break-ins, were elevated in the transgender community, with members twice as likely to be a victim of it than cisgender Americans.
This article originally appeared on Statista.com and was syndicated by MediaFeed.org.
More from MediaFeed:
US approval of marriage equality at all-time high

The support for marriage equality in the United States increased overall between 2016 and 2021. According to a survey conducted across the years, this increase was particularly relevant among Republicans. This was consistently the party group least in favor of gay marriage, but in 2021, for the first time, a slight majority of Republicans showed support for it. As of the same year, 83 percent of the Democrats’ electorate thought that LGBTQ marriage should be recognized by the law as valid.
Here’s the share of Americans who think LGBTQ marriage should be recognized by the law as valid from 2016 to 2021, by political party affiliation.
SPONSORED: Find a Qualified Financial Advisor
1. Finding a qualified financial advisor doesn’t have to be hard. SmartAsset’s free tool matches you with up to 3 fiduciary financial advisors in your area in 5 minutes.
2. Each advisor has been vetted by SmartAsset and is held to a fiduciary standard to act in your best interests. If you’re ready to be matched with local advisors that can help you achieve your financial goals, get started now.
CREATISTA / istockphoto

- Republicans: 40%
- Independents: 65%
- Democrats: 79%
monkeybusinessimages / iStock

- Republicans: 47%
- Independents: 71%
- Democrats: 74%
steved_np3 / iStock

- Republicans: 44%
- Independents: 71%
- Democrats: 83%
ajr_images / iStock

- Republicans: 44%
- Independents: 68%
- Democrats: 79%
Ridofranz / iStock

- Republicans: 49%
- Independents: 71%
- Democrats: 83%
Alessandro Biascioli / iStock

- Republicans: 55%
- Independents: 73%
- Democrats: 83%
AndreyPopov / iStock

Statista used data from a Gallup survey released in June 2021. The results are from 1,016 adult Americans respondents who participated in a phone interview. You can find more information here.
This article originally appeared on Statista.com and was syndicated by MediaFeed.org.
AmberLaneRoberts / iStock

DJMcCoy / iStock
Featured Image Credit: Sabrina Bracher / iStock.
AlertMe


