The hottest real estate markets of 2022 (so far)

FeaturedHome BuyingMoney

Written by:


The coronavirus pandemic saw many real estate markets leap upward. Some saw home prices jump over 40% in a single year!


Pick your reason as to why. People spending more time at home are focused more on their home, and usually wish they had more space. Many homeowners took on home improvement projects. The sudden collapse and meteoric recovery of the stock market left many investors seeking firmer assets, particularly as a hedge against inflation in the face of record government spending and new currency creation.

______________________

SPONSORED: Find a Qualified Financial Advisor

1. Finding a qualified financial advisor doesn't have to be hard. SmartAsset's free tool matches you with up to 3 fiduciary financial advisors in your area in 5 minutes.

2. Each advisor has been vetted by SmartAsset and is held to a fiduciary standard to act in your best interests. If you're ready to be matched with local advisors that can help you achieve your financial goals get started now.

______________________


But America’s re-infatuation with real estate hasn’t been evenly spread. Which begs the question: what are the hottest real estate markets in the U.S. right now?

The 100 Hottest Real Estate Markets in 2022

Using data from Zillow, we calculated and mapped the top 100 hottest real estate markets in the US.

Notice any patterns?


You’ll probably spot first that they’re largely concentrated in the West and Southeast. The Upper Midwest got shut out completely.


Nearly all of these hot markets are smaller cities rather than major metropolises. For example, the fastest growing real estate market over the last year was Kalispell (MT) with an eye-popping 56.40% jump in home prices. Rounding out the top five are Naples, Florida (47.24%), Summit Park, Utah (44.73%), Fort Myers (44.36%), and Edwards, Colorado (43.76%).

!function(){“use strict”;window.addEventListener(“message”,(function(e){if(void 0!==e.data[“datawrapper-height”]){var t=document.querySelectorAll(“iframe”);for(var a in e.data[“datawrapper-height”])for(var r=0;r<t.length;r++){if(t[r].contentWindow===e.source)t[r].style.height=e.data[“datawrapper-height”][a]+”px”}}}))}();

Still, more large cities made the list in the second quarter of 2022. Tampa real estate spiked 33.12%. Phoenix saw home prices leap 30.20%. Jacksonville jumped 31.05%, Las Vegas 32.43%, and Atlanta 29.98%.


If you’re looking to invest in real estate long-distance, consider researching these markets. But beware that higher prices don’t necessarily mean higher rents, and you could just find yourself with weaker cash flow. Make sure you do your due diligence, and consider buying turnkey properties if you’re out of state. You can even potentially buy properties with tenants already paying rent, particularly if you use a platform like Roofstock.

SPONSORED: Find a Qualified Financial Advisor

1. Finding a qualified financial advisor doesn’t have to be hard. SmartAsset’s free tool matches you with up to 3 fiduciary financial advisors in your area in 5 minutes.

2. Each advisor has been vetted by SmartAsset and is held to a fiduciary standard to act in your best interests. If you’re ready to be matched with local advisors that can help you achieve your financial goals get started now.

Heat Map: Fastest Appreciating Counties

Cities are all well and good, but I like the depth that county-level data provides.


Here’s how real estate performed in (nearly) every county in the U.S. over the last year:


!function(){“use strict”;window.addEventListener(“message”,(function(e){if(void 0!==e.data[“datawrapper-height”]){var t=document.querySelectorAll(“iframe”);for(var a in e.data[“datawrapper-height”])for(var r=0;r<t.length;r++){if(t[r].contentWindow===e.source)t[r].style.height=e.data[“datawrapper-height”][a]+”px”}}}))}();

Some counties saw year-over-year home price increases of more than 50%!


One trend we witnessed in 2020 and 2021 was an acceleration of the de-urbanization trend, particularly in the largest, most expensive cities. But in many cases, residents simply moved out to the suburbs surrounding the same city, and therefore stayed in the same county.


We also keep an eye on nationwide migration trends, particularly the extent to which Americans are leaving high-tax states in favor of lower-tax states. But these migration trends can’t perfectly explain the hottest real estate markets in 2020-2022.


Take New Jersey, one of the states with the highest taxes and greatest outbound migration. Every county in South Jersey saw year-over-year home price growth of over 10%!


Or Vermont, with its high inbound migration. Sure, it saw strong appreciation by historical standards, but nowhere near what you’d expect.


Note: The gray counties didn’t have sufficient MLS sales data to trigger median home values.

Best Cities for Investing Based on GRM & Cap Rates

Appreciation isn’t everything, of course. You still need the property to cash flow well, or you end up coming out of pocket.


If you’re looking for the best housing markets in the U.S. for cash flow, here’s a map of the 100 largest cities in the U.S., contrasting their gross rent multiplier (GRM). Remember, lower is better!

!function(){“use strict”;window.addEventListener(“message”,(function(a){if(void 0!==a.data[“datawrapper-height”])for(var e in a.data[“datawrapper-height”]){var t=document.getElementById(“datawrapper-chart-“+e)||document.querySelector(“iframe[src*='”+e+”‘]”);t&&(t.style.height=a.data[“datawrapper-height”][e]+”px”)}}))}();

Alternatively, see this list of the cities with the best cap rates. (If you’re not familiar with them, here’s an overview of how cap rates work).


Before buying a rental property, always run the numbers through a rental income calculator. Most new real estate investors underestimate expenses and fail to calculate real estate cash flow property.

What Drives Hot Housing Markets?

Real estate prices rise for many reasons. But at their core, they rise because demand for homes outstrips a limited supply of available housing.


As you scout for the best cities for real estate investing, keep the following trends in mind.

Population Growth

It sounds obvious, and it is. But where there’s strong population growth, there’s nearly always strong real estate appreciation.


Unfortunately, official Census Bureau data on population growth lags by a year or two. That leaves investors relying on less official data to try to track population trends.

Economic & Job Growth

What drives population growth? Job growth, at least traditionally. A booming local economy attracts people to move from all over the country. In fact, job growth often serves as a leading indicator of population growth.


However, in an age of greater telecommuting, inherent amenities like shoreline or a historic vibe can draw inbound migration even without abundant local jobs.

Increase in First-Time Homebuyers

When a homeowner goes to move, and simultaneously sells their old home while buying a new one, it doesn’t change the total housing inventory available. They add their own home to the inventory for sale, and they take their new home off the market.


First-time homebuyers, however, don’t have an existing home to sell. So, they take a home off the market by buying it, without adding to the available inventory.


In other words, they add to the demand for housing, but not the supply. Which drives up home prices.

What Happens When Hot Real Estate Markets Cool?

Even the best housing markets in the US, the hottest real estate markets, eventually cool off. It can happen gradually, or it can happen (relatively) suddenly, such as we saw in the housing bubble collapse after 2008.


Housing markets go through predictable cycles. A dearth of housing supply spurs more new home construction. Home builders gradually build up a head of steam, as the process from finding sites through pulling permits to building the home to marketing and selling them all takes time. At a certain point, housing developers start building more homes than the local demand actually needs or wants, but by the time they discover that, they still have months or even years to go in order to finish existing construction projects.


At that point, supply exceeds demand, and you see a housing market correction. Developers stop building, and eventually supply gets pinched again, and the cycle repeats itself.


Here’s a handy visual aid for good measure:

Market quandrants cycle

Is the US in a Housing Bubble Currently?

While parts of the U.S. could already be in a bubble, I doubt that most of the country’s markets are in a bubble, even the hottest real estate markets.


To begin with, supply, particularly of starter homes, remains insufficient to cover demand, to put it mildly. Building material and labor costs hover around record highs, putting additional upward pressure on home prices.


Meanwhile, millennials have reached the “settle down in the suburbs and pop out some kids” phase in their lives. See above about the increase in first-time homebuyers supercharging demand for housing.


So no, I don’t see a real estate bubble, at least for most markets in the U.S..

Final Thoughts

At the moment, I see a great reshuffling of the deck taking place in real estate markets. While the largest, most expensive cities like New York and LA will never become irrelevant, even before the pandemic we saw rents and demand dipping. The rise in telecommuting should exacerbate that trend even after the pandemic is in the rearview mirror.


I see continued hot housing markets in areas with natural charm. Areas with beautiful beaches or lakes, with great skiing and hiking, with history and culture. Post-industrial cities will need to reinvent themselves if they want to retain high-income residents after they discover they can live anywhere and telecommute to work.


Keep an eye on all of the hottest real estate markets in 2022 showcased in the maps above. And note that the best housing markets in the U.S. are mostly satellite towns, seeing astronomical growth.


This article originally appeared on SparkRental.com and was syndicated by MediaFeed.org.

More from MediaFeed:

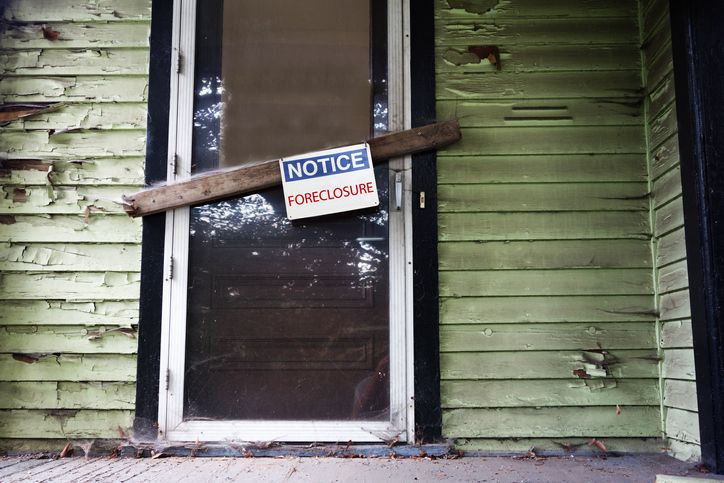
Here’s where US foreclosure rates are soaring


Editor’s Note: Updated for May 2022


The number of U.S. properties with foreclosure filings in April was 30,674, according to ATTOM Data Solutions. This is up close to 160% from a year ago and makes April the 12th consecutive month showing year-over-year U.S. foreclosure activity increases. The Biden administration’s final extension of the pandemic-related moratorium on foreclosures ended July 31, 2021. The extension of the evictions moratorium for foreclosed borrowers ended September 30, 2021.


It is also worth noting that foreclosure filings decreased by close to 8% from March to April. The experts at ATTOM say this may be due to record levels of homeowner equity and the current hot housing market, allowing distressed homeowners the chance to sell their homes before going into final foreclosure. However, they say it may take a few months to see if this is what is happening.


According to ATTOM, year-over-year foreclosure increases will likely continue for the rest of 2022; however, they still expect foreclosures to stay below historic levels at least through the end of the year. Read on for the foreclosure rates in April 2022 – plus the five counties with the highest rates within those states.


Related: The safest cities in the US


DepositPhotos.com


As just noted, foreclosures are up from last month, and up even more significantly compared to last year. Read on for April foreclosure rates for all 50 states — plus the District of Columbia — beginning with the state that had the lowest rate of foreclosure filings per housing unit.


DepositPhotos.com


Ranking in population between Vermont and Alaska, the country’s 49th and 48th least populated states, Washington, D.C. had 10 foreclosures in April. With a total of 350,364 housing units, Washington, D.C.’s foreclosure rate was one in every 35,036 households, putting it in between the states of Kansas (#48) and North Dakota (#47).


DepositPhotos.com


South Dakota once again nabbed the 50th spot; it had six homes go into foreclosure in April. Having 389,921 total housing units, the fifth least populated state had a foreclosure rate of one in every 64,987 households. Only three counties saw foreclosures in April. The counties with the most foreclosures per housing unit were (from highest to lowest): Lawrence, Minnehaha, and Lincoln.


RiverNorthPhotography


In 49th place for population, Vermont claimed the 49th spot for its foreclosure rate. Of Vermont’s 334,318 housing units, seven homes went into foreclosure for a rate of one in every 47,760 households. The counties with the most foreclosures per housing unit were (from highest to lowest): Orange, Franklin, Windham, Washington, and Rutland.


” DonLand”


Kansas took the 48th spot. With 1,275,689 homes and a total of 35 housing units going into foreclosure, the 35th most-populated state’s foreclosure rate was one in every 36,448 households. The counties with the most foreclosures per housing unit were (from highest to lowest): Geary, Leavenworth, Seward, Shawnee, and Miami.


Michael Pham


North Dakota’s foreclosure rate was one in every 33,695 homes. That puts the fourth least populated state – with a total of 370,642 housing units, of which 11 were in foreclosure — in 47th place. The counties with the most foreclosures per housing unit were (from highest to lowest): Morton, Stark, Ward, Cass, and Williams.


sequential5


The 44th most populated state ranked 46th once again for foreclosure rate. With 18 foreclosures out of 514,803 housing units, its foreclosure rate was one in every 28,600 homes. The counties with the most foreclosures per housing unit were (from highest to lowest): Chouteau, Broadwater, Rosebud, Yellowstone, and Lewis And Clark.


YinYang


The 39th most populated state, West Virginia, ranked 45th. It has 855,635 homes, of which 56 went into foreclosure. That means the foreclosure rate was one in every 15,279 homes. The counties with the most foreclosures per housing unit were (from highest to lowest): Tyler, Lewis, Fayette, Boone, and Cabell.


DepositPhotos.com


The 27th most populated state ranked 44th for highest foreclosure rate. Of Oregon’s 1,813,747 homes, 130 went into foreclosure, making for a foreclosure rate of one in every 13,952 homes. The counties with the most foreclosures per housing unit were (from highest to lowest): Morrow, Polk, Klamath, Washington, and Multnomah.


HaizhanZheng


With a total 1,994,323 housing units, Kentucky saw 148 homes go into foreclosure. That put the foreclosure rate for the 26th most populated state at one in every 13,475 households. The counties with the most foreclosures per housing unit were (from highest to lowest): Martin, Grant, Washington, Lincoln, and Webster.


Thomas Kelley


Ranked 13th for most populated state, Washington came in 42nd place for highest foreclosure rate. It has 320,2241 housing units, of which 251 went into foreclosure, making the state’s foreclosure rate one in every 12,758 households. The counties with the most foreclosures per housing unit were (from highest to lowest): Douglas, Chelan, Okanogan, Skamania, and Grays Harbor.


4nadia


Ranked 33rd for most populated state, Arkansas took the 41st spot for highest foreclosure rate. It has 1,365,265 housing units, of which 122 went into foreclosure, making the state’s latest foreclosure rate one in every 11,191 households. The counties with the most foreclosures per housing unit were (from highest to lowest): Woodruff, Lincoln, Ashley, Grant, and Mississippi.


Recommended: Tips on Buying a Foreclosed Home


Rdlamkin


Ranked the least populated in the country, Wyoming claimed the 40th spot for highest foreclosure rate. With 271,887 housing units, of which 26 went into foreclosure, the state’s foreclosure rate was one in every 10,457 households. The counties with the most foreclosures per housing unit were (from highest to lowest): Crook, Carbon, Campbell, Sublette, and Big Horn.


AnujSahaiPhotography


In Tennessee, the 16th most populated state, there were 291 foreclosures out of 3,031,605 housing units. That put the foreclosure rate at one in every 10,418 homes. The counties with the most foreclosures per housing unit were (from highest to lowest): Wayne, Hardeman, Bledsoe, Humphreys, and White.


NathanMerrill


The eighth least populated state took the 38th spot for highest foreclosure rate. A total of 51 homes went into foreclosure out of 483,474 total housing units, making the foreclosure rate for the Ocean State one in every 9,480 households. The counties with the most foreclosures per housing unit were (from highest to lowest): Providence, Bristol, Newport, Washington, and Kent.


DepositPhotos.com


The 40th most populated state, Hawaii came in 37th for highest foreclosure rate. Of 561,066 homes, 61 went into foreclosure, making for a foreclosure rate of one in every 9,198 households. Only three counties in the state had foreclosures. They were (from highest to lowest): Hawaii, Maui, and Honolulu.


Art Wager


The 41st most populated state, New Hampshire ranked 36th for highest foreclosure rate. Of 638,795 homes, 70 went into foreclosure, making for a foreclosure rate of one in every 9,126 households. The counties with the most foreclosures per housing unit were (from highest to lowest): Cheshire, Sullivan, Grafton, Rockingham, and Strafford.


DenisTangneyJr


Utah placed 35th for highest foreclosure rate. Of the Beehive State’s 1,151,414 housing units, 135 homes went into foreclosure, making the 30th most-populated state’s foreclosure rate one in every 8,529 households. The counties with the most foreclosures per housing unit were (from highest to lowest): Sevier, Tooele, Morgan, Box Elder, and Emery.


AndreyKrav


Alaska saw 38 foreclosures, making the foreclosure rate one in every 8,356 homes. That caused the third least populated state, with a total of 317,524 housing units, to take the 34th spot. Only four counties saw foreclosures in April (from highest to lowest): Anchorage, Matanuska-Susitna, Fairbanks North Star, and Kenai Peninsula.


Chilkoot


The 38th most populated state, Idaho had 91 homes go into foreclosure. With 751,859 total housing units, the state’s foreclosure rate was one in every 8,262 households. The counties with the most foreclosures per housing unit were (from highest to lowest): Lewis, Lincoln, Oneida, Benewah, and Shoshone.


knowlesgallery


Ranked 18th for most populated state, Maryland took 32nd place for highest foreclosure rate. With a total of 2,530,844 housing units, of which 322 housing units went into foreclosure, the state’s foreclosure rate was one in every 7,860 households. The counties with the most foreclosures per housing unit were (from highest to lowest): Prince George’s County, Charles, Garrett, Baltimore City, and Calvert.


James_Lane


With 392 foreclosures out of 2,727,726 total housing units, Wisconsin, the 20th most populated state, had a foreclosure rate of one in every 6,958 households. The counties with the most foreclosures per housing unit were (from highest to lowest): Marquette, Kenosha, Douglas, Dodge, and Langlade.


Recommended: What Is a Short Sale?


FierceAbin


Ranked 37th for population, Nebraska claimed the 30th spot with a foreclosure rate of one in every 6,920 homes. With a total 844,278 housing units, the state had 122 foreclosure filings. The counties with the most foreclosures per housing unit were (from highest to lowest): Knox, Madison, Jefferson, Cedar, and Lancaster.


marekuliasz


The 15th most populated state ranked 29th for highest foreclosure rate. Of Massachusetts’ 2,998,537 housing units, 446 went into foreclosure, making for a foreclosure rate of one in every 6,723 homes. The counties with the most foreclosures per housing unit were (from highest to lowest): Plymouth, Hampden, Franklin, Berkshire, and Worcester.


Rolf_52


With 1,268 out of a total 8,488,066 housing units going into foreclosure, the fourth most populated state took the 28th spot. New York’s foreclosure rate was one in every 6,694 households. The counties with the most foreclosures per housing unit were (from highest to lowest): Genesee, Suffolk, Washington, Montgomery, and Tioga.


Eloi_Omella


The 36th most populated state took the 27th spot for highest foreclosure rate. Of its 940,859 homes, 141 went into foreclosure, making for a foreclosure rate of one in every 6,673 homes. The counties with the most foreclosures per housing unit were (from highest to lowest): Chaves, Cibola, Eddy, Valencia, and Torrance.


Davel5957


The 19th most populated state, Missouri came in 26th for highest rate of foreclosures. Of its 2,786,621 homes, 443 went into foreclosure, making for a foreclosure rate of one in every 6,290 homes. The counties with the most foreclosures per housing unit were (from highest to lowest): Jefferson, New Madrid, Webster, Butler, and Gasconade.


eyecrave


The 12th most populated state ranked 25th for highest foreclosure rate, with 581 homes going into foreclosure. Having 3,618,247 total housing units, the state saw a foreclosure rate of one in every 6,228 households. The counties with the most foreclosures per housing unit were (from highest to lowest): Nottoway, Portsmouth City, Essex, Warren, and Greene.


DenisTangneyJr


In Mississippi, the 34th most populated state, there were 213 foreclosures out of 1,319,945 housing units. That put the foreclosure rate at one in every 6,197 homes. The counties with the most foreclosures per housing unit were (from highest to lowest): Sharkey, Stone, Claiborne, Benton, and Adams.


stevegeer


Ranked 25th for population, Louisiana took the 23rd spot, with 338 homes out of a total of 2,073,200 housing units going into foreclosure. That means Louisiana had a foreclosure rate of one in every 6,134 households. The counties with the most foreclosures per housing unit were (from highest to lowest): West Baton Rouge, Iberville, Beauregard, Tangipahoa, and Richland.


DenisTangneyJr


Ranked as the ninth least populated state, Maine placed 22nd for highest foreclosure rate. With a total of 739,072 housing units, the Pine Tree State saw 126 foreclosures for a foreclosure rate of one in every 5,866 homes. The counties with the most foreclosures per housing unit were (from highest to lowest): Waldo, Aroostook, Somerset, Penobscot, and Androscoggin.


DepositPhotos.com


Ranked 24th for most populated, Alabama came in 21st for highest foreclosure rate. Of its 2,288,330 homes, 391 went into foreclosure, making for a foreclosure rate of one in every 5,853 homes. The counties with the most foreclosures per housing unit were (from highest to lowest): Dale, Barbour, Montgomery, Covington, and Conecuh.


Recommended: 4 Signs You May Be Ready to Buy


James Deitsch


Pennsylvania has the 20th highest foreclosure rate. The fifth most populated state had a total of 1,120 housing units out of 5,742,828 homes go into foreclosure, making the state’s foreclosure rate one in every 5,128 households. The counties with the most foreclosures per housing unit were (from highest to lowest): Potter, Delaware, Philadelphia, Bucks, and Pike.


AppalachianViews


The Lone Star State saw 2,297 foreclosures. With a foreclosure rate of one in every 5,045 households, this put the second most populous state with 11,589,324 housing units into the 19th spot – the same ranking it held in March. The counties with the most foreclosures per housing unit were (from highest to lowest): Dickens, Ector, Collingsworth, Shackelford, and Nacogdoches.


DenisTangneyJr


In Arizona, the 14th most populated state, there were 614 foreclosures out of 3,082,000 housing units. That put the foreclosure rate at one in every 5,020 homes. The counties with the most foreclosures per housing unit were (from highest to lowest): Graham, Yavapai, Cochise, Pinal, and Greenlee.


wanderluster


The ninth most populated state took 12th place for highest foreclosure rate. Out of 4,708,710 homes, 967 went into foreclosure. That put the Tar Heel State’s foreclosure rate at one in every 4,869 homes. The counties with the most foreclosures per housing unit were (from highest to lowest): Gates, Washington, Polk, Cumberland, and Hoke.


DepositPhotos.com


Ranking 10th for population, Michigan took the 16th spot with a foreclosure rate of one in every 4,771 homes. With a total of 4,570,173 housing units, the state had 958 foreclosure filings. The counties with the most foreclosures per housing unit were (from highest to lowest): Saint Joseph, Genesee, Macomb, Schoolcraft, and Shiawassee.


haveseen


Oklahoma claimed the ninth spot. With housing units totaling 1,746,807, the 28th most populated state saw 380 homes go into foreclosure at a rate of one in every 4,597 homes. The counties with the most foreclosures per housing unit were (from highest to lowest): Washita, Canadian, Craig, Love, and Garfield.


DepositPhotos.com


The eighth most populated state, Georgia ranked 14th for highest foreclosure rate. Of its 4,410,956 homes, 1,004 were foreclosed on. That put the state’s foreclosure rate at one in every 4,393 households. The counties with the most foreclosures per housing unit were (from highest to lowest): Candler, Crawford, Polk, Baker, and Peach.


SeanPavonePhoto


Ranked 22nd for most populated state, Minnesota took the 13th spot for highest foreclosure rate. It has 2,485,558 housing units, of which 568 went into foreclosure, making the state’s foreclosure rate one in every 4,376 households. The counties with the most foreclosures per housing unit were (from highest to lowest): Grant, Faribault, Mower, Clay, and Isanti.


JoeChristensen


The most populated state ranked 12th for highest foreclosure rate. Of its 14,392,140 housing units, 3,465 went into foreclosure, making California’s foreclosure rate one in every 4,154 households. The counties with the most foreclosures per housing unit were (from highest to lowest): Lake, Siskiyou, Kern, Trinity, and Madera.


mlauffen


With 377 of its 1,530,197 homes going into foreclosure, Connecticut had the 11th highest foreclosure rate of one in every 4,059 households. In the 29th most populated state, the counties that had the most foreclosures per housing unit were (from highest to lowest): Windham, Middlesex, New Haven, Hartford, and Litchfield.


Recommended: Your 2022 Guide to All Things Home


traveler1116


Iowa had the tenth highest foreclosure rate. With 353 housing units out of 1,412,789 homes going into foreclosure, the 31st most populated state’s foreclosure rate was one in every 4,002 homes. The counties with the most foreclosures per housing unit were (from highest to lowest): Fremont, Cass, Winnebago, Wapello, and Tama.


JoeChristensen


The third most populated state in the country has a total of 9,865,350 housing units, of which 2,906 went into foreclosure. The state’s ninth highest foreclosure rate is one in every 3,395 homes. The counties with the most foreclosures per housing unit were (from highest to lowest): Hamilton, Calhoun, Taylor, Gilchrist, and Union.


Elisa.rolle


The sixth least populated state in the country, Delaware ranked fourth for highest foreclosure rate. With one in every 3,138 homes going into foreclosure and a total 448,735 housing units, Delaware saw a total of 143 foreclosure filings. With only three counties in the state, the most foreclosures per housing unit were in (from highest to lowest): Kent, New Castle, and Sussex.


mdgmorris


With one in every 3,085 homes going into foreclosure, South Carolina moved out of the top three to take the seventh spot. Ranked 23rd for population, South Carolina has 2,344,963 housing units and saw 760 foreclosure filings. The counties with the most foreclosures per housing unit were (from highest to lowest): Barnwell, Lexington, Dorchester, Marion, and Darlington.


SeanPavonePhoto


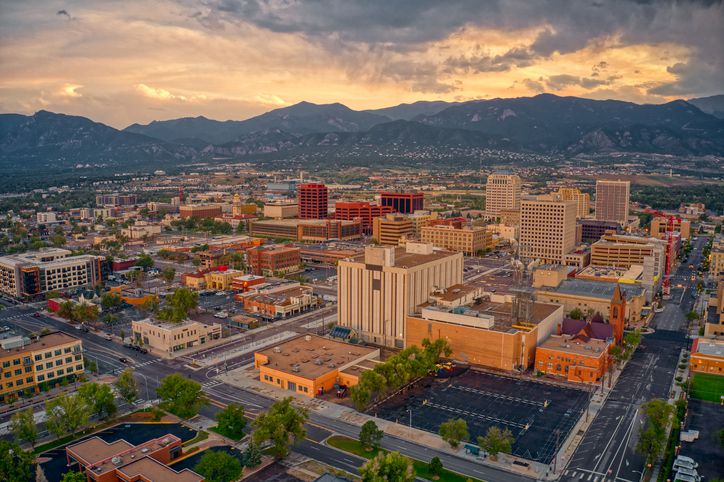
The 21st most populated state ranked 6th for highest foreclosure rate. Of Colorado’s 2,491,404 housing units, 812 went into foreclosure, making for a foreclosure rate of one in every 3,068 homes. The counties with the most foreclosures per housing unit were (from highest to lowest): Pueblo, Delta, Mesa, Weld, and Morgan.


Jacob Boomsma / istockphoto


Ranking 32nd in population, Nevada took the fifth spot for foreclosure rate. With one in every 3,043 homes going into foreclosure and a total of 1,281,018 housing units, the state had 421 foreclosure filings. The counties with the most foreclosures per housing unit were (from highest to lowest):Clark, Nye, Washoe, Elko, and Lyon.


AlizadaStudios


The 17th largest state by population, Indiana took the fourth spot with a foreclosure rate of one in every 2,660 homes. Of its 2,923,175 homes, 1,099 homes were foreclosed on in April. The counties with the most foreclosures per housing unit were (from highest to lowest): Noble, Grant, Clinton, Lake, and Elkhart.


f11photo


Ohio claimed the third spot, with a foreclosure rate of one in every 2,585 homes. With a total of 5,242,524 housing units, the seventh most populated state had a total of 2,028 filings. The counties with the most foreclosures per housing unit were (from highest to lowest): Cuyahoga, Huron, Muskingum, Logan, and Greene.


dypics


With a foreclosure rate of one in every 2,292 homes, New Jersey held on to second place. The 11th most populated state has 3,761,229 housing units, of which 1,641 went into foreclosure. The counties with the most foreclosures per housing unit were (from highest to lowest): Cumberland, Salem, Warren, Camden, and Gloucester.


DepositPhotos.com


Illinois took the number one spot again in April. Of its 5,426,429 homes, 2,421 went into foreclosure, making the sixth most populated state’s foreclosure rate one in every 2,241. The counties with the most foreclosures per housing unit were (from highest to lowest): Will, Madison, Lee, Tazewell, and Mchenry.


ibsky


Of all 50 states, California had the most foreclosure filings (3,465); South Dakota had the least (6). As for the states with the highest foreclosure rates, Illinois, New Jersey, and Ohio took the top three spots, respectively.


The Great Lakes region had the largest presence among the 10 states that ranked the highest for foreclosure rates. These states were (from highest to lowest): Illinois, Ohio, and Indiana.


The Plains region and the Southeast region tied for the largest presence among the 10 states that ranked the lowest for foreclosure rates. The states in the Plains region were (from highest to lowest): North Dakota, Kansas, and South Dakota. The states in the Southeast region were (from highest to lowest): Arkansas, Kentucky, and West Virginia.


Learn More:

This article originally appeared on SoFi.comand was syndicated by MediaFeed.org.


SoFi Loan Products

SoFi loans are originated by SoFi Lending Corp. or an affiliate (dba SoFi), a lender licensed by the Department of Financial Protection and Innovation under the California Financing Law, license # 6054612; NMLS # 1121636. For additional product-specific legal and licensing information, see SoFi.com/legal.


SoFi Home Loans
Terms, conditions, and state restrictions apply. SoFi Home Loans are not available in all states. See SoFi.com/eligibility for more information.


External Websites: The information and analysis provided through hyperlinks to third party websites, while believed to be accurate, cannot be guaranteed by SoFi. Links are provided for informational purposes and should not be viewed as an endorsement.


zimmytws / istockphoto


svetikd


Featured Image Credit: fizkes/istockphoto.

AlertMe